


-Board Declares Quarterly Dividend
-Provides Business Update
KINGSTON, NY / ACCESSWIRE / August 11, 2022 / Kingstone Companies, Inc. (Nasdaq:KINS) (the "Company" or "Kingstone"), a Northeast regional property and casualty insurance holding company, today announced its financial results for the quarter ended June 30, 2022. The Company will host a conference call for analysts and investors on August 12, 2022, at 8:30 a.m. Eastern Time, as previously announced on July 6, 2022.
2022 Second Quarter Financial and Operational Highlights
(All results are compared to prior year quarterly period unless otherwise noted)
- Operating loss per share1 of $(0.17) compared to $(0.05)
- Unrealized losses on equity securities and other investments, net of tax of $(0.31) per share compared to unrealized gains of $0.12 per share
- Realized losses on investments, net of tax of $(0.02) per share compared to realized gains of $0.05 per share
- Decrease to Accumulated Other Comprehensive Loss of $6.0 million or ($0.57) per share
- Net loss per share of $(0.51) compared to earnings per share of $0.12
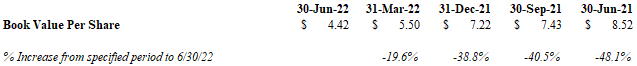
- Book value per share of $4.42
- Direct written premiums1 grew by 11.6% to $49.8 million
- Net premiums earned decreased 21.3% to $27.9 million due to the inception of a 30% personal lines quota share treaty on December 30, 2021
- Net loss ratio of 66.9% compared to 58.6% due non-weather related water damage property claims and elevated fire severity
- Net underwriting expense ratio decreased to 36.4% from 41.8%
- Net combined ratio increased to 103.3% from 100.4% driven by the increase in the loss ratio.
Quarterly Dividend of $0.04 per share
The Company announced that its Board of Directors declared a quarterly dividend of $0.04 per share payable on September 15, 2022 to stockholders of record at the close of business on August 31, 2022.
__________________
1 These measures are not based on accounting principles generally accepted in the United States ("GAAP") and are defined and reconciled below to the most directly comparable GAAP measures.
Management Commentary
Barry Goldstein, Kingstone's Chairman and Chief Executive Officer, elaborated on the Company's results:
"Our second quarter operating results demonstrate progress from our ongoing Kingstone 2.0 initiatives. Only six months after the launch of our ‘Select' Homeowners and Dwelling Fire products, we are seeing increased adoption of these modern personal lines products that better match rate to risk and are expected to result in an associated decline in the loss ratio. We continued to grow our premium base, resulting in writings up over 11% in the quarter, with a majority of our growth stemming from approved rate increases since 2021. While our net earnings and book value declined primarily due to the continuing increase in interest rates during the quarter, we are now seeing moderate rate improvement that we expect to benefit our operations moving forward. Coupled with our high-quality, A+ rated portfolio composed of obligations from a group of strong and diverse issuers, we are confident in our ability to recover certain losses at maturity and drive enhanced value for stockholders."
Meryl Golden, Kingstone's Chief Operating Officer, continued:
"We were pleased to see our net underwriting expense ratio decrease by 5.4 points to 36.4% during the second quarter. As our Kingstone 2.0 initiatives continue on track, we are actively working to reduce expenses. Most notably, we are in the final stages of our legacy system replacement, which has been a monumental effort by our team. We look forward to seeing these changes become increasingly reflected in our results throughout the remainder of the year."
Business Update
The Kingstone Board of Directors and management team regularly reviews Kingstone's strategic, operational and financial priorities in the context of the operating environment and with the objective of driving enhanced stockholder value. Consistent with this, following the Company's fourth quarter 2021 operational review, the Board of Directors engaged TigerRisk Capital Markets & Advisory as its financial advisor to aid in the exploration of a range of options that might have the potential for creating enhanced stockholder value.
As previously announced on May 6, 2022, the Company received a preliminary non-binding indication of interest with regard to an acquisition of all of the outstanding equity of the Company. Following the third party's substantial completion of its due diligence, Kingstone received a final non-binding indication of interest and agreed with the third party to extend the previously executed exclusivity agreement to further pursue the proposal.
No assurances can be given that a transaction will be consummated, and the Company does not intend to provide any additional updates regarding the proposal unless and until an agreement is reached or the Company determines that a disclosure is required. The Kingstone Board of Directors is committed to acting in the best interests of the Company and its stockholders and will continue to take actions consistent with that objective.
See "Forward-Looking Statements"
Financial Highlights Table
| Three Months Ended | Six Months Ended | ||||||||||||||||||||||
| June 30, | June 30, | ||||||||||||||||||||||
($ in thousands except per share data) | 2022 | 2021 | % Change | 2022 | 2021 | % Change | |||||||||||||||||
Direct written premiums1 | $ | 49,778 | $ | 44,616 | 11.6 | % | $ | 92,762 | $ | 82,745 | 12.1 | % | |||||||||||
Net written premiums1 | $ | 30,026 | $ | 37,314 | -19.5 | % | $ | 54,944 | $ | 68,114 | -19.3 | % | |||||||||||
Net premiums earned | $ | 27,902 | $ | 35,436 | -21.3 | % | $ | 54,575 | $ | 70,026 | -22.1 | % | |||||||||||
Total ceding commission revenue | $ | 4,716 | $ | 46 | 10152.2 | % | $ | 9,397 | $ | 45 | 20782.2 | % | |||||||||||
Net investment income | $ | 634 | $ | 1,678 | -62.2 | % | $ | 1,993 | $ | 3,461 | -42.4 | % | |||||||||||
Net (losses) gains on investments | $ | (4,517 | ) | $ | 2,315 | na | $ | (8,916 | ) | $ | 5,276 | na | |||||||||||
U.S. GAAP Net (loss) income | $ | (5,380 | ) | $ | 1,323 | na | $ | (14,577 | ) | $ | 1,012 | na | |||||||||||
U.S. GAAP Diluted (loss) earnings per share | $ | (0.51 | ) | $ | 0.12 | na | $ | (1.37 | ) | $ | 0.09 | na | |||||||||||
Comprehensive (loss) income | $ | (11,409 | ) | $ | 1,902 | na | $ | (28,368 | ) | $ | (1,741 | ) | -1529.4 | % | |||||||||
Net operating loss1 | $ | (1,811 | ) | $ | (506 | ) | -257.9 | % | $ | (7,534 | ) | $ | (3,156 | ) | -138.7 | % | |||||||
Net operating loss1 per share | $ | (0.17 | ) | $ | (0.05 | ) | -264.7 | % | $ | (0.71 | ) | $ | (0.29 | ) | -142.6 | % | |||||||
Return on average equity (annualized) | -40.8 | % | 5.9 | % | -46.7 pts | -47.5 | % | 2.2 | % | -49.7 pts | |||||||||||||
Net loss ratio | 66.9 | % | 58.6 | % | 8.3 pts | 76.2 | % | 61.9 | % | 14.3 pts | |||||||||||||
Net underwriting expense ratio | 36.4 | % | 41.8 | % | -5.4 pts | 37.4 | % | 41.9 | % | -4.5 pts | |||||||||||||
Net combined ratio | 103.3 | % | 100.4 | % | 2.9 pts | 113.6 | % | 103.8 | % | 9.8 pts | |||||||||||||
Effect of catastrophes and prior year loss | |||||||||||||||||||||||
development on net combined ratio1 | 1.4 pts | -0.3 pts | 1.7 pts | 6.2 pts | 0.2 pts | 6.0 pts | |||||||||||||||||
Net combined ratio excluding effect of | |||||||||||||||||||||||
catastrophes and prior year loss | |||||||||||||||||||||||
development1 | 101.9 | % | 100.7 | % | 1.2 pts | 107.4 | % | 103.6 | % | 3.8 pts | |||||||||||||
1 These measures are not based on GAAP and are defined and reconciled below to the most directly comparable GAAP measures.
2022 Second Quarter Financial Review
Net income:
The loss during the three-month period ended June 30, 2022 was $5.4 million as compared to a net income of $1.3 million in the prior year period. The net loss in the latest three-month period is attributed to non-weather related water damage property claims and elevated fire severity leading to an 8.3 point increase in net loss ratio, and $4.2 million of net unrealized losses on equity and other investments compared to a net unrealized gain on equity and other investments of $1.6 million in the prior year period.
Earnings (Loss) per share ("EPS"):
Kingstone reported a loss of $(0.51) per diluted share for the three months ended June 30, 2022, compared to earnings of $0.12 per diluted share for the three months ended June 30, 2021. EPS for the three-month periods ended June 30, 2022 and 2021 was based on 10.6 million and 10.8 million weighted average diluted shares outstanding, respectively.
Direct Written Premiums,1 Net Written Premiums1 and Net Premiums Earned
Direct written premiums1 for the second quarter of 2022 were $49.8 million, an increase of $5.2 million or 11.6% from $44.6 million in the prior year period. The increase is primarily attributable to a $4.3 million increase in premiums from our personal lines business and a $0.8 million increase in livery physical damage.
Net written premiums1 decreased $7.3 million, or 19.5%, to $30.0 million during the three-month period ended June 30, 2022 from $37.3 million in the prior year period. The decrease was attributable to the inception of the 30% personal lines quota share on December 30, 2021 offset by growth in direct written premiums.
Net premiums earned for the quarter ended June 30, 2022 decreased 21.3% to $27.9 million, compared to $35.4 million for the quarter ended June 30, 2021. The decrease was attributable to the inception of the 30% personal lines quota share treaty on December 30, 2021.
Net Loss Ratio:
For the quarter ended June 30, 2022, the Company's net loss ratio was 66.9%, compared to 58.6% in the prior year period. The net loss ratio increase from the prior year period was due to non-weather related water damage property claims and elevated fire severity. There were three minor wind events classified as catastrophes, and favorable catastrophe development during the three months ended June 30, 2022 added 0.4 points to the quarter's loss ratio compared to -0.3 points in the prior year quarter. There was 1.0 point of non-catastrophe prior year development on fire claims during the current period compared to none in the prior year period.
Net Underwriting Expense Ratio:
For the quarter ended June 30, 2022, the net underwriting expense ratio was 36.4% as compared to 41.8% in the prior year period, a decrease of 5.4 percentage points. The decrease in the quarter was attributable to the inception of the 30% personal lines quota share treaty as well as only a modest increase in commission expense and a decline in underwriting expenses.
____________________
1 These measures are not based on GAAP and are defined and reconciled below to the most directly comparable GAAP measures.
Balance Sheet / Investment Portfolio
Kingstone's cash and investment holdings were $193.8 million at June 30, 2022 compared to $234.1 million at June 30, 2021. The Company's investment holdings are comprised primarily of investment grade corporate, mortgage-backed and municipal securities, with fixed income investments representing approximately 82.7% of total investments at June 30, 2022 and 77.3% at June 30, 2021. The Company's effective duration on its fixed-income portfolio is 5.5 years.
Net investment income decreased to $0.6 million for the second quarter of 2022 from $1.7 million in the prior year period following the fixed income realignment designed to improve credit quality in the 3rd and 4th quarters of 2021 and higher manager and custodial investment expenses. In addition, there was a $0.8 million reversal of prior years' estimated accrued interest income during the second quarter stemming from an error in third party investment reporting.
Accumulated Other Comprehensive Income/Loss (AOCI), net of tax
As of June 30, 2022, AOCI was a loss of $(12.0) million compared to income of $7.1 million at June 30, 2021. The decrease in AOCI at June 30, 2022 of $19.1 million as compared to June 30, 2021 is attributable to the increase in interest rates most notably occurring in Q1 and Q2 2022.
Share Repurchase Program
The Company announced a share repurchase program in March 2021. During the three months ended June 30, 2022, the Company did not repurchase any shares.
Book Value
The Company's book value per share at June 30, 2022 was $4.42, a decline of 38.8% compared to $7.22 at December 31, 2021.
FOR ADDITIONAL INFORMATION PLEASE VISIT OUR WEBSITE AT WWW.KINGSTONECOMPANIES.COM.
Conference Call Details
Management will discuss the Company's operations and financial results in a conference call on Friday, August 12, 2022, at 8:30 a.m. ET.
The dial-in numbers are:
(877) 407-3105 (U.S.)
(201) 493-6794 (International)
Accompanying Webcast
The call will be simultaneously webcast over the Internet via the Kingstone website or by clicking on the conference call link:
Kingstone Companies Second Quarter Financial Results Webcast
The webcast will be archived and accessible for approximately 30 days.
Definitions and Non-GAAP Measures
Direct written premiums represent the total premiums charged on policies issued by the Company during the respective fiscal period. Net premiums written are direct written premiums less premiums ceded to reinsurers. Net premiums earned, the GAAP measure most comparable to direct written premiums and net premiums written, are net premiums written that are pro-rata earned during the fiscal period presented. All of the Company's policies are written for a twelve-month period. Management uses direct written premiums and net premiums written, along with other measures, to gauge the Company's performance and evaluate results.
Net operating income (loss)- is net income (loss) exclusive of realized investment gains (losses), net of tax. Net income (loss) is the GAAP measure most closely comparable to net operating income (loss).
Management uses net operating income (loss) along with other measures to gauge the Company's performance and evaluate results, which can be skewed when including realized investment gains (losses), and may vary significantly between periods. Net operating income (loss) is provided as supplemental information, not as a substitute for net income (loss) and does not reflect the Company's overall profitability.
Net combined ratio excluding effect of catastrophes and prior year loss development - is a non-GAAP ratio, which is computed as the difference between GAAP net combined ratio and the effect of catastrophes and prior year loss development on the net combined ratio.
We believe that these ratios are useful to investors and they are used by management to reveal the trends in our business that may be obscured by catastrophe losses and prior year loss development. Catastrophe losses cause our loss ratios to vary significantly between periods as a result of their incidence of occurrence and magnitude, and can have a significant impact on the net loss ratio and net combined ratio. Prior year loss development can cause our loss ratio to vary significantly between periods and separating this information allows us to better compare the results for the current accident period over time. We believe these measures are useful for investors to evaluate these components separately and in the aggregate when reviewing our underwriting performance. We also provide them to facilitate a comparison to our outlook on the net combined ratio excluding the effect of catastrophes and prior year loss development. The most directly comparable GAAP measure is the net combined ratio. The net combined ratio excluding the effect of catastrophes and prior year loss development should not be considered a substitute for the net combined ratio and does not reflect the Company's net combined ratio.
The table below reconciles direct written premiums and net written premiums to net premiums earned for the periods presented:
| For the Three Months Ended | For the Six Months Ended | |||||||||||||||||||||||||||||||
| June 30, | June 30, | |||||||||||||||||||||||||||||||
| % | % | |||||||||||||||||||||||||||||||
| 2022 | 2021 | $ Change | Change | 2022 | 2021 | $ Change | Change | |||||||||||||||||||||||||
(000's except percentages) | ||||||||||||||||||||||||||||||||
Direct and Net Written Premiums Reconciliation: | ||||||||||||||||||||||||||||||||
Direct written premiums | $ | 49,778 | $ | 44,616 | $ | 5,162 | 11.6 | % | $ | 92,762 | $ | 82,745 | $ | 10,017 | 12.1 | % | ||||||||||||||||
Ceded written premiums | (19,752 | ) | (7,302 | ) | (12,450 | ) | 170.5 | (37,818 | ) | (14,631 | ) | (23,187 | ) | 158.5 | ||||||||||||||||||
Net written premiums | 30,026 | 37,314 | (7,288 | ) | (19.5 | )% | 54,944 | 68,114 | (13,170 | ) | (19.3 | )% | ||||||||||||||||||||
Change in unearned premiums | (2,123 | ) | (1,877 | ) | (246 | ) | 13.1 | (368 | ) | 1,912 | (2,280 | ) | na | |||||||||||||||||||
Net premiums earned | $ | 27,902 | $ | 35,436 | $ | (7,534 | ) | (21.3 | )% | $ | 54,575 | $ | 70,026 | $ | (15,451 | ) | (22.1 | )% | ||||||||||||||
(Components may not sum due to rounding)
The following table reconciles net operating loss to net (loss) income for the periods indicated:
| For the Three Months Ended | For the Six Months Ended | |||||||||||||||||||||||||||||||
| June 30, 2022 | June 30, 2021 | June 30, 2022 | June 30, 2021 | |||||||||||||||||||||||||||||
| Amount | Diluted earnings (loss) per common share | Amount | Diluted earnings (loss) per common share | Amount | Diluted earnings (loss) per common share | Amount | Diluted earnings (loss) per common share | |||||||||||||||||||||||||
(000's except per common share amounts and percentages) | ||||||||||||||||||||||||||||||||
Net (Loss) Income and Diluted (Loss) Earnings per Common Share Reconciliation: | ||||||||||||||||||||||||||||||||
Net (loss) income | $ | (5,380 | ) | $ | (0.51 | ) | $ | 1,323 | $ | 0.12 | $ | (14,577 | ) | $ | (1.37 | ) | $ | 1,012 | $ | 0.09 | ||||||||||||
Net realized loss (gain) on investments | 4,517 | (2,315 | ) | 8,916 | (5,276 | ) | ||||||||||||||||||||||||||
Less tax benefit (expense) on net realized loss (gain) | 949 | (486 | ) | 1,872 | (1,108 | ) | ||||||||||||||||||||||||||
Net realized loss (gain) on investments, net of taxes | 3,568 | $ | 0.34 | (1,829 | ) | $ | (0.17 | ) | 7,044 | $ | 0.66 | (4,168 | ) | $ | (0.39 | ) | ||||||||||||||||
Net operating loss | $ | (1,811 | ) | $ | (0.17 | ) | $ | (506 | ) | $ | (0.05 | ) | $ | (7,534 | ) | $ | (0.71 | ) | $ | (3,156 | ) | $ | (0.29 | ) | ||||||||
Weighted average diluted shares outstanding | 10,644,578 | 10,846,724 | 10,637,553 | 10,809,924 | ||||||||||||||||||||||||||||
(Components may not sum due to rounding)
The following table reconciles the net combined ratio excluding catastrophes and prior year loss development to the net combined ratio for the periods presented:
| For the Three Months Ended | For the Six Months Ended | ||||||||||||||||||||||
| June 30, | June 30, | ||||||||||||||||||||||
| 2022 | 2021 | Percentage Point Change | 2022 | 2021 | Percentage Point Change | ||||||||||||||||||
Net Combined Ratio Excluding Catastrophes and Prior Year Development Reconciliation: | |||||||||||||||||||||||
Net Combined Ratio Excluding Catastrophes and Prior Year Development | 101.9 | % | 100.7 | % | 1.2 | pts | 107.4 | % | 103.6 | % | 3.8 | pts | |||||||||||
Effect of catastrophe losses and prior year development | |||||||||||||||||||||||
Catastrophe losses | 0.4 | % | -0.3 | % | 0.7 | pts | 5.7 | % | 0.2 | % | 5.5 | pts | |||||||||||
Prior year development | 1.0 | % | 0.0 | % | 1.0 | pts | 0.5 | % | 0.0 | % | 0.5 | pts | |||||||||||
Effect of catastrophe losses and prior year development on net loss and loss adjustment expenses | 1.4 | % | -0.3 | % | 1.7 | pts | 6.2 | % | 0.2 | % | 6.0 | pts | |||||||||||
Net underwriting expense ratio | 0.0 | % | 0.0 | % | - | pts | 0.0 | % | 0.0 | % | - | pts | |||||||||||
Total effect of catastrophe losses and prior year development | 1.4 | % | -0.3 | % | 1.7 | pts | 6.2 | % | 0.2 | % | 6.0 | pts | |||||||||||
Net combined ratio | 103.3 | % | 100.4 | % | 2.9 | pts | 113.6 | % | 103.8 | % | 9.8 | pts | |||||||||||
The following table reconciles the net combined ratio excluding catastrophes to the net combined ratio for the periods presented:
| For the Three Months Ended | For the Six Months Ended | ||||||||||||||||||||||
| June 30, | June 30, | ||||||||||||||||||||||
| 2022 | 2021 | Percentage Point Change | 2022 | 2021 | Percentage Point Change | ||||||||||||||||||
Net Combined Ratio Excluding Catastrophes Reconciliation: | |||||||||||||||||||||||
Net Combined Ratio Excluding Catastrophes | 102.9 | % | 100.7 | % | 2.2 | pts | 107.9 | % | 103.6 | % | 4.3 | pts | |||||||||||
Catastrophe losses | 0.4 | % | -0.3 | % | 0.7 | pts | 5.7 | % | 0.2 | % | 5.5 | pts | |||||||||||
Net combined ratio | 103.3 | % | 100.4 | % | 2.9 | pts | 113.6 | % | 103.8 | % | 9.8 | pts | |||||||||||
The following table summarizes gross and net written premiums, net premiums earned, net loss and loss adjustment expenses and net loss ratio by major product type, which were determined based primarily on similar economic characteristics and risks of loss.
| For the Three Months Ended | For the Six Months Ended | |||||||||||||||
| June 30, | June 30, | |||||||||||||||
| 2022 | 2021 | 2022 | 2021 | |||||||||||||
Gross premiums written: | ||||||||||||||||
Personal lines(3) | $ | 46,792,267 | $ | 42,449,870 | $ | 86,955,416 | $ | 78,608,363 | ||||||||
Livery physical damage | 2,953,588 | 2,119,436 | 5,726,868 | 4,023,428 | ||||||||||||
Other(1) | 32,608 | 46,719 | 80,076 | 113,826 | ||||||||||||
Total without commercial lines | 49,778,463 | 44,616,025 | 92,762,360 | 82,745,617 | ||||||||||||
Commercial lines (in run-off effective July 2019)(2) | - | (381 | ) | - | (856 | ) | ||||||||||
Total gross premiums written | $ | 49,778,463 | $ | 44,615,644 | $ | 92,762,360 | $ | 82,744,761 | ||||||||
Net premiums written: | ||||||||||||||||
Personal lines(3) | $ | 27,048,585 | $ | 35,149,321 | $ | 49,159,250 | $ | 63,979,133 | ||||||||
Livery physical damage | 2,953,588 | 2,119,436 | 5,726,868 | 4,023,428 | ||||||||||||
Other(1) | 23,607 | 45,903 | 57,850 | 112,184 | ||||||||||||
Total without commercial lines | 30,025,780 | 37,314,660 | 54,943,968 | 68,114,745 | ||||||||||||
Commercial lines (in run-off effective July 2019)(2) | - | (381 | ) | - | (856 | ) | ||||||||||
Total net premiums written | $ | 30,025,780 | $ | 37,314,279 | $ | 54,943,968 | $ | 68,113,889 | ||||||||
Net premiums earned: | ||||||||||||||||
Personal lines(3) | $ | 25,178,854 | $ | 33,573,620 | $ | 49,339,070 | $ | 66,338,707 | ||||||||
Livery physical damage | 2,687,273 | 1,804,543 | 5,161,838 | 3,569,819 | ||||||||||||
Other(1) | 35,941 | 58,644 | 74,540 | 117,974 | ||||||||||||
Total without commercial lines | 27,902,068 | 35,436,807 | 54,575,448 | 70,026,500 | ||||||||||||
Commercial lines (in run-off effective July 2019)(2) | - | (381 | ) | - | (856 | ) | ||||||||||
Total net premiums earned | $ | 27,902,068 | $ | 35,436,426 | $ | 54,575,448 | $ | 70,025,644 | ||||||||
Net loss and loss adjustment expenses(4): | ||||||||||||||||
Personal lines | $ | 16,356,939 | $ | 18,638,287 | $ | 36,783,580 | $ | 39,394,940 | ||||||||
Livery physical damage | 1,180,223 | 1,015,064 | 2,010,792 | 1,702,476 | ||||||||||||
Other(1) | (967 | ) | 223,472 | (24,367 | ) | 253,821 | ||||||||||
Unallocated loss adjustment expenses | 1,164,649 | 909,591 | 2,743,555 | 1,915,872 | ||||||||||||
Total without commercial lines | 18,700,844 | 20,786,414 | 41,513,560 | 43,267,109 | ||||||||||||
Commercial lines (in run-off effective July 2019)(2) | (44,803 | ) | (27,204 | ) | 83,679 | 52,773 | ||||||||||
Total net loss and loss adjustment expenses | $ | 18,656,041 | $ | 20,759,210 | $ | 41,597,239 | $ | 43,319,882 | ||||||||
Net loss ratio(4): | ||||||||||||||||
Personal lines | 65.0 | % | 55.5 | % | 74.6 | % | 59.4 | % | ||||||||
Livery physical damage | 43.9 | % | 56.3 | % | 39.0 | % | 47.7 | % | ||||||||
Other(1) | -2.7 | % | 381.1 | % | -32.7 | % | 215.1 | % | ||||||||
Total without commercial lines | 67.0 | % | 58.7 | % | 76.1 | % | 61.8 | % | ||||||||
Commercial lines (in run-off effective July 2019)(2) | na | na | na | na | ||||||||||||
Total | 66.9 | % | 58.6 | % | 76.2 | % | 61.9 | % | ||||||||
- "Other" includes, among other things, premiums and loss and loss adjustment expenses from our participation in a mandatory state joint underwriting association and loss and loss adjustment expenses from commercial auto.
- In July 2019, the Company decided that it will no longer underwrite Commercial Liability risks. See discussions above regarding the discontinuation of this line of business.
- See discussion with regard to "Direct Written Premiums, Net Written Premiums and Net Premiums Earned" above.
- See discussions above with regard to "Net Loss Ratio".
KINGSTONE COMPANIES, INC. AND SUBSIDIARIES | ||||||||||||||||
| Condensed Consolidated Statements of Operations and Comprehensive Income (Loss) (Unaudited) | ||||||||||||||||
| For the Three Months Ended, | For the Six Months Ended, | |||||||||||||||
| June 30, | June 30, | |||||||||||||||
| 2022 | 2021 | 2022 | 2021 | |||||||||||||
Revenues | ||||||||||||||||
Net premiums earned | $ | 27,902,068 | $ | 35,436,426 | $ | 54,575,448 | $ | 70,025,644 | ||||||||
Ceding commission revenue | 4,715,587 | 45,741 | 9,396,983 | 44,676 | ||||||||||||
Net investment income | 634,325 | 1,678,075 | 1,993,425 | 3,461,271 | ||||||||||||
Net (losses) gains on investments | (4,517,373 | ) | 2,315,261 | (8,915,778 | ) | 5,275,668 | ||||||||||
Other income | 244,643 | 124,946 | 480,467 | 296,392 | ||||||||||||
Total revenues | 28,979,250 | 39,600,449 | 57,530,545 | 79,103,651 | ||||||||||||
Expenses | ||||||||||||||||
Loss and loss adjustment expenses | 18,656,041 | 20,759,210 | 41,597,239 | 43,319,882 | ||||||||||||
Commission expense | 8,481,031 | 8,285,341 | 16,832,117 | 16,509,180 | ||||||||||||
Other underwriting expenses | 6,624,997 | 6,692,920 | 13,440,946 | 13,159,962 | ||||||||||||
Other operating expenses | 665,815 | 933,272 | 1,547,770 | 2,285,578 | ||||||||||||
Depreciation and amortization | 877,263 | 837,654 | 1,647,373 | 1,659,994 | ||||||||||||
Interest expense | 456,545 | 456,545 | 913,090 | 913,090 | ||||||||||||
Total expenses | 35,761,692 | 37,964,942 | 75,978,535 | 77,847,686 | ||||||||||||
(Loss) income from operations before taxes | (6,782,442 | ) | 1,635,507 | (18,447,990 | ) | 1,255,965 | ||||||||||
Income tax (benefit) provision | (1,402,823 | ) | 312,146 | (3,870,839 | ) | 243,701 | ||||||||||
Net (loss) income | (5,379,619 | ) | 1,323,361 | (14,577,151 | ) | 1,012,264 | ||||||||||
Other comprehensive (loss) income, net of tax | ||||||||||||||||
Gross change in unrealized (losses) gains | ||||||||||||||||
on available-for-sale-securities | (7,642,863 | ) | 1,074,164 | (17,508,640 | ) | (2,749,115 | ) | |||||||||
Reclassification adjustment for losses (gains) | ||||||||||||||||
included in net (loss) income | 10,356 | (341,474 | ) | 51,680 | (735,771 | ) | ||||||||||
Net change in unrealized (losses) gains | (7,632,507 | ) | 732,690 | (17,456,960 | ) | (3,484,886 | ) | |||||||||
Income tax benefit (provision) related to items | ||||||||||||||||
of other comprehensive (loss) income | 1,602,827 | (153,865 | ) | 3,665,963 | 731,827 | |||||||||||
Other comprehensive (loss) income, net of tax | (6,029,680 | ) | 578,825 | (13,790,997 | ) | (2,753,059 | ) | |||||||||
Comprehensive (loss) income | $ | (11,409,299 | ) | $ | 1,902,186 | $ | (28,368,148 | ) | $ | (1,740,795 | ) | |||||
(Loss) earnings per common share: | ||||||||||||||||
Basic | $ | (0.51 | ) | $ | 0.12 | $ | (1.37 | ) | $ | 0.09 | ||||||
Diluted | $ | (0.51 | ) | $ | 0.12 | $ | (1.37 | ) | $ | 0.09 | ||||||
Weighted average common shares outstanding | ||||||||||||||||
Basic | 10,644,578 | 10,670,831 | 10,637,553 | 10,673,550 | ||||||||||||
Diluted | 10,644,578 | 10,846,724 | 10,637,553 | 10,809,924 | ||||||||||||
Dividends declared and paid per common share | $ | 0.04 | $ | 0.04 | $ | 0.08 | $ | 0.08 | ||||||||
| KINGSTONE COMPANIES, INC. AND SUBSIDIARIES | ||||||||
Condensed Consolidated Balance Sheets | June 30, 2022 | Decenver 31, 2021 | ||||||
| (unaudited) | ||||||||
Assets | ||||||||
Fixed-maturity securities, held-to-maturity, at amortized cost (fair value of | ||||||||
$6,913,536 at June 30, 2022 and $8,753,159 at December 31, 2021) | $ | 7,768,218 | $ | 8,266,334 | ||||
Fixed-maturity securities, available-for-sale, at fair value (amortized cost of | ||||||||
$156,683,115 at June 30, 2022 and $155,808,478 at December 31, 2021) | 141,497,787 | 158,080,110 | ||||||
Equity securities, at fair value (cost of $30,239,520 at June 30, 2022 and | ||||||||
$37,470,669 at December 31, 2021) | 26,064,545 | 39,687,002 | ||||||
Other investments | 5,253,582 | 7,561,415 | ||||||
Total investments | 180,584,132 | 213,594,861 | ||||||
Cash and cash equivalents | 13,200,128 | 24,290,598 | ||||||
Premiums receivable, net | 11,994,265 | 12,318,336 | ||||||
Reinsurance receivables, net | 54,652,171 | 40,292,438 | ||||||
Deferred policy acquisition costs | 22,025,938 | 22,238,987 | ||||||
Intangible assets | 500,000 | 500,000 | ||||||
Property and equipment, net | 10,185,098 | 9,291,597 | ||||||
Deferred income taxes, net | 7,344,092 | 192,253 | ||||||
Other assets | 6,147,440 | 8,593,205 | ||||||
Total assets | $ | 306,633,264 | $ | 331,312,275 | ||||
Liabilities | ||||||||
Loss and loss adjustment expense reserves | $ | 98,903,060 | $ | 94,948,745 | ||||
Unearned premiums | 98,152,959 | 97,759,607 | ||||||
Advance premiums | 5,773,444 | 2,693,466 | ||||||
Reinsurance balances payable | 10,877,113 | 12,961,568 | ||||||
Deferred ceding commission revenue | 9,759,340 | 9,748,508 | ||||||
Accounts payable, accrued expenses and other liabilities | 6,166,043 | 7,704,396 | ||||||
Debt, net | 29,911,881 | 29,823,791 | ||||||
Total liabilities | 259,543,840 | 255,640,081 | ||||||
Commitments and Contingencies | ||||||||
Stockholders' Equity | ||||||||
Preferred stock, $.01 par value; authorized 2,500,000 shares | - | - | ||||||
Common stock, $.01 par value; authorized 20,000,000 shares; issued 12,117,081 shares | ||||||||
at June 30, 2022 and 11,955,660 shares at December 31, 2021; outstanding | ||||||||
10,645,675 shares at June 30, 2022 and 10,484,254 shares at December 31, 2021 | 121,171 | 119,557 | ||||||
Capital in excess of par | 73,102,513 | 72,467,483 | ||||||
Accumulated other comprehensive (loss) income | (11,994,258 | ) | 1,796,739 | |||||
(Accumulated deficit) retained earnings | (8,572,521 | ) | 6,855,896 | |||||
| 52,656,905 | 81,239,675 | |||||||
Treasury stock, at cost, 1,471,406 shares at June 30, 2022 | ||||||||
and December 31, 2021 | (5,567,481 | ) | (5,567,481 | ) | ||||
Total stockholders' equity | 47,089,424 | 75,672,194 | ||||||
Total liabilities and stockholders' equity | $ | 306,633,264 | $ | 331,312,275 | ||||
About Kingstone Companies, Inc.
Kingstone is a northeast regional property and casualty insurance holding company whose principal operating subsidiary is Kingstone Insurance Company ("KICO"). KICO is a New York domiciled carrier writing business through retail and wholesale agents and brokers. KICO offers primarily personal lines insurance products in New York, New Jersey, Rhode Island, Massachusetts, and Connecticut. Kingstone is also licensed in Pennsylvania, New Hampshire and Maine.
Forward-Looking Statements
Statements in this press release may contain "forward-looking statements" within the meaning of the Private Securities Litigation Reform Act of 1995. All statements, other than statements of historical facts, may be forward-looking statements. These statements are based on management's current expectations and are subject to uncertainty and changes in circumstances. These statements involve risks and uncertainties that could cause actual results to differ materially from those included in forward-looking statements due to a variety of factors. For more details on factors that could affect expectations, see Part I, Item 1A of our Annual Report on Form 10-K for the year ended December 31, 2021 filed with the Securities and Exchange Commission under "Factors That May Affect Future Results and Financial Condition" and Part I, Item 2 and Part II, Item 1A of our Quarterly Report on Form 10-Q for the period ended June 30, 2022 to be filed with the Securities and Exchange Commission. These risks and uncertainties include, without limitation, the following:
- As a property and casualty insurer, we may face significant losses from catastrophes and severe weather events.
- Unanticipated increases in the severity or frequency of claims may adversely affect our operating results and financial condition.
- We are exposed to significant financial and capital markets risk which may adversely affect our results of operations, financial condition and liquidity, and our net investment income can vary from period to period.
- The insurance industry is subject to extensive regulation that may affect our operating costs and limit the growth of our business, and changes within this regulatory environment may adversely affect our operating costs and limit the growth of our business.
- Changing climate conditions may adversely affect our financial condition, profitability or cash flows.
- Because a significant portion of our revenue is currently derived from sources located in New York, our business may be adversely affected by conditions in such state.
- We are highly dependent on a relatively small number of insurance brokers for a large portion of our revenues.
- Actual claims incurred may exceed current reserves established for claims, which may adversely affect our operating results and financial condition.
- We rely on our information technology and telecommunication systems, and the failure of these systems could materially and adversely affect our business.
- We have received a preliminary non-binding indication of interest with regard to the acquisition of all of the outstanding equity of our Company. No assurances can be given that a transaction will be consummated.
Kingstone undertakes no obligation to publicly update or revise any forward-looking statements, whether as a result of new information, future events or otherwise, except as required by law.
CONTACT:
Kingstone Companies, Inc.
Amanda M. Goldstein
Investor Relations Director
(516) 960-1319
SOURCE: Kingstone Companies, Inc