


VANCOUVER, BC / ACCESSWIRE / September 8, 2020 / Sarama Resources Ltd. ("Sarama" or the "Company") is pleased to announce a significant increase and upgrade in mineral resources for the Tankoro Gold Deposit, which is the key component of its Sanutura Project (the "Project") in south-west Burkina Faso.
The Sanutura Project represents the consolidation of the Company's South Houndé and ThreeBee Projects into a single, 100%-owned, advanced-stage exploration project covering approximately 1,500km² (refer Figure 1) that hosts a significant, well-defined mineral resource base and a suite of exploration targets.
The updated mineral resource estimate at the Tankoro Gold Deposit now stands at:
- 9.4Mt @ 1.9g/t Au for 0.6Moz gold (indicated); plus
- 43.6Mt @ 1.4g/t Au for 1.9Moz gold (inferred)(1).
This represents a significant increase over the 2016 inferred mineral resource estimate of 43.0Mt @ 1.5g/t Au for 2.1Moz Au(2) (refer Appendix B) which was reported on an unconstrained/semi-global basis compared to the 2020 mineral resource estimate which is reported using open pit shell and underground mining shape constraints.
The mineral resource contains a significant higher-grade component of 6.3Mt @ 2.5g/t Au for 0.5Moz gold (indicated) plus 24.7Mt @ 1.8g/t Au for 1.5Moz gold (inferred)(3) using a 1.0g/t Au cut-off. This highlights the presence of higher-grade zones within the greater mineralised system which will be the focal point for development. Infill drilling in certain higher-grade areas has increased geological confidence considerably, allowing for the maiden classification of parts of the mineral resources as ‘indicated'.
The combined oxide and transition component of the mineral resource totals 0.2Moz gold (indicated) plus 0.7Moz gold (inferred)(4), representing a significant increase to the previous estimate of 0.6Moz gold (inferred)(2) for corresponding material types. This increase reflects the Company's exploration focus on near-surface, oxide targets to provide early plant feed to support a potential staged development of the Project.
Highlights
- Mineral resources of 0.6Moz gold (indicated) plus 1.9Moz gold (inferred)(1)
- Significant amount of higher-grade material of 6.3Mt @ 2.5g/t Au for 0.5Moz Au (indicated) plus 24.7Mt @ 1.8g/t Au for 1.5Moz Au (inferred)(3) contained within the mineral resource
- Oxide and transition material increased to 33% of the mineral resource and now totals 0.2Moz Au (indicated) and 0.7Moz Au (inferred)(4) which has the potential to provide early feed for a multi-stage mine development
- Approximately 25% of the mineral resource upgraded to ‘indicated' classification with drilling increasing geological confidence in high-grade zones
- 70% of the defined mineral resource is situated within 150m from surface
- Mineral resources extend approximately 16km along strike within a lithological and structural corridor approximately 1.4km wide, illustrating the scale of the mineralised system
- Metallurgical testwork demonstrates gold recoveries of 93% for oxide and 91% for fresh rock
- Work programs to focus on exploration and planning to support feasibility work due to commence in late 2021
Mineral Resource Estimate
The independent mineral resource estimate for the Tankoro Gold Deposit was undertaken by Cube Consulting Pty Ltd (Perth, Western Australia) and incorporated the results of exploration activities undertaken at Sarama's 100%-owned Sanutura Project since the previous mineral resource estimate in January 2016.
The updated mineral resource for the Tankoro Gold Deposit of 9.4Mt @ 1.9g/t Au for 0.6Moz Au (indicated) and 43.6Mt @ 1.4g/t Au for 1.9Moz (inferred)(1) (refer Table 1) is principally contained in an extensive package of mineralised lenses interpreted to extend over a semi-continuous strike length of approximately 16km in a trend that spans approximately 1.4km across the strike (refer Figure 2). A large portion of the mineral resource has only been drill-tested to approximately 70m depth, however drilling of certain higher-grade zones has shown the system to extend to 550m depth where it remains open.
The mineralized corridor, as presently defined by drilling, lies within a 30km-long, gold-in-soil geochemical anomaly that remains a key focus for ongoing exploration.
A second mineralised trend in the east of the Project area, also defined by a large gold-in-soil geochemical anomaly extending for 30km, hosts mineralisation which contributes to the Project's mineral resource base for the first time. This demonstrates the potential of the Project to host mineralisation of significance outside the historically well-drilled areas and remains an exploration target.
The mineral resource features a higher-grade component of 6.3Mt @ 2.5g/t Au for 0.5Moz Au (indicated) plus 24.7Mt @ 1.8g/t Au for 1.5Moz Au (inferred)(3) which reflects the presence of numerous higher-grade zones within the mineralised system. These zones are typically located in areas of structural complexity with an associated increase in the volume of the package of stacked lodes, which the Company would seek to leverage to provide early plant feed in a potential mine development. Figure 2 illustrates the core areas of the MM and MC Prospects which feature higher-grade mineralisation in structurally complex settings.
A significant increase in the oxide and transition components of the mineral resource to 3.2Mt @ 1.6g/t Au for 0.2Moz Au (indicated) plus 20.1Mt @ 1.0g/t Au for 0.7Moz Au (inferred) has been delivered by the update (the previous mineral resource estimate for these components in 2016 was 0.6Moz Au(2) (inferred)). Sarama has specifically targeted this type of material in recent drilling programs to provide early plant feed for a potential staged mine development. Forward exploration programs will continue to target this material.
The revised mineral resource estimate benefits from the addition of approximately 66,000m air-core (1,176 holes), 12,000m reverse-circulation (117 holes) and 14,000m diamond drilling (49 holes) within the Project area since the 2016 estimate. This drilling has confirmed gold mineralisation to be hosted predominantly within altered porphyritic intrusions and meta-sedimentary rocks along an anastomosing shear zone, with higher-grade mineralised zones located at structural intersections. The mineralized structural corridors are located in a sequence of metasedimentary rocks that include mudstone, sandstone, greywacke and conglomerate.
Sub-vertical felsic porphyry units of multiple intrusive phases are the dominant host unit for gold mineralisation, however the sedimentary sequence also hosts gold mineralisation associated with quartz veining and disseminated pyrite-arsenopyrite. Recent oxide-focussed drilling in the south of the Project has delineated several flat-lying lenses of mineralisation, dipping in both easterly and westerly directions, which are considered highly amenable to mining by open pit methods.
Various phases of alteration have been noted, with chlorite-carbonate-hematite alteration progressively overprinted by sericite-albite assemblages. Higher-grade zones of mineralisation are associated with well-developed, structurally controlled silica-albite proximal alteration zones and elevated sulphide (pyrite) content.
Structural interpretation within the immediate area of the inferred mineral resource is based on detailed core logging and ground and airborne geophysical data. This work has resulted in the correlation of higher-grade zones of mineralisation with apparent cross structures, a key relationship which will be used to generate near-fields and distal targets in future exploration programs.
In addition to the stated mineral resources, an exploration target of a further 3.5-4.3Mt @ 1.2-1.4g/t Au for 135-190koz Au(5) of modelled and estimated mineralisation is contained within the open pit shell and underground blockouts. A secondary exploration target of 12.0-14.7Mt @ 1.2-1.4g/t for 0.5-0.7Moz Au(6) has been modelled and estimated outside the constraining mining shapes. While the potential quantity and grade of these exploration targets is conceptual in nature and there has been insufficient exploration to define a mineral resource and it is uncertain if further exploration will result in the target being delineated as a mineral resource, they present viable exploration targets for the Company to pursue.
Table 1 summarises the updated mineral resource for the Tankoro Deposit and Appendix A contains detailed breakdowns as well as notes outlining the methodology used for interpretation, estimation and classification.
Table 1 - Mineral Resources(A,B) - All Prospects
|
Geological Classification |
Material Type (C,D) |
Reporting Cut-off Grade(E) |
Tonnage Above Cut-off Grade |
Average Grade Above Cut-off Grade |
Contained Gold Above Cut-off Grade |
Metal Contribution |
|
g/t Au |
Mt |
g/t Au |
koz Au |
% |
||
|
Indicated |
Oxide (OP) |
0.2 |
2.5 |
1.5 |
123 |
21% |
|
Transition (OP) |
0.3 |
0.7 |
1.7 |
38 |
6% |
|
|
Fresh (OP) |
0.5 |
6.1 |
2.1 |
409 |
70% |
|
|
Sub-total (OP) |
9.3 |
1.9 |
570 |
98% |
||
|
Fresh (UG) |
1.6 |
0.1 |
2.4 |
11 |
2% |
|
|
Total Indicated |
9.4 |
1.9 |
582 |
100% |
||
|
Inferred |
Oxide (OP) |
0.2 |
16.8 |
1.0 |
551 |
29% |
|
Transition (OP) |
0.3 |
3.3 |
1.1 |
115 |
6% |
|
|
Fresh (OP) |
0.3-0.5(F) |
20.1 |
1.4 |
924 |
49% |
|
|
Sub-total (OP) |
40.2 |
1.2 |
1,589 |
84% |
||
|
Fresh (UG) |
1.6 |
3.4 |
2.8 |
305 |
16% |
|
|
Total Inferred |
43.6 |
1.4 |
1,894 |
100% |
||
Table Notes
A. Mineral resources are not mineral reserves and do not demonstrate economic viability.
B. All tonnage, grade and ounces have been rounded and minor discrepancies in additive totals may occur.
C. Weathering classification is based on visual assessment of drill core and cuttings by geologists and does not represent a definitive geo-metallurgical classification.
D. Mineral resources are reported as a mining shape-constrained subset of the modelled mineral inventory following assessment for ‘reasonable prospects for eventual economic extraction' by the generation of open pit optimisation shells ("OP") and underground mining blockouts ("UG"). The assessment is not supported by a preliminary economic assessment or a feasibility study and the geological classification and reporting categorisations do not imply that mineral resources demonstrate economic viability. OP and UG constrained mineral resources are exclusive of each other.
E. Cut-off grades were determined using a gold price of US$1800/oz, metallurgical recoveries supported by testwork and based on oxide material being processed by a CIL flowsheet and transition and fresh material being processed by a flotation+BIOX®+CIL flowsheet and operating cost assumptions for mining, processing and G&A activities considered appropriate for the anticipated configuration of a potential development at the Project.
F. Fresh material at the Guy, Legbenege and Poggle Prospects is assumed to be free-milling and reported at a cut-off grade of 0.3g/t Au. All other OP fresh mineral resources reported at a cut-off grade of 0.5g/t Au.
The Company will prepare and file a technical report under National Instrument 43-101 within 45 days of the date of this news release.
Sarama's President and CEO, Andrew Dinning commented:
"We are very pleased to be able to present a combined picture of our 100% owned assets in our southern Houndé Belt development area. The significant increase in the mineral resource has a material impact on the project development picture, as does the material increase in oxide and transition material which now represents a third of the quoted mineral resource.
Our next key step in advancing this project is to integrate the high-grade Bondi Deposit, which has a significant historical resource, while also targeting near field resources which when combined, give us an exploration target in excess of 3 million ounces of gold and will facilitate the development of a long-life, multi-stage asset that can be built and paid for well before we have exploited the oxide resource.
The project provides significant optionality and leverage to the gold price and remains key to the development of the southern Houndé Belt."
For further information on the Company's activities, please contact:
Andrew Dinning or Paul Schmiede
e: [email protected]
t: +61 (0) 8 9363 7600
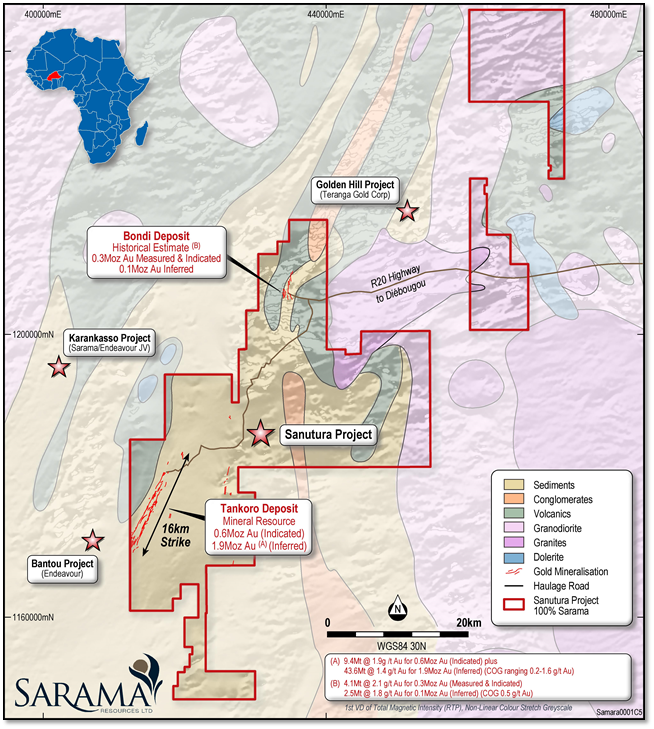
Figure 1 - Sanutura Project Location
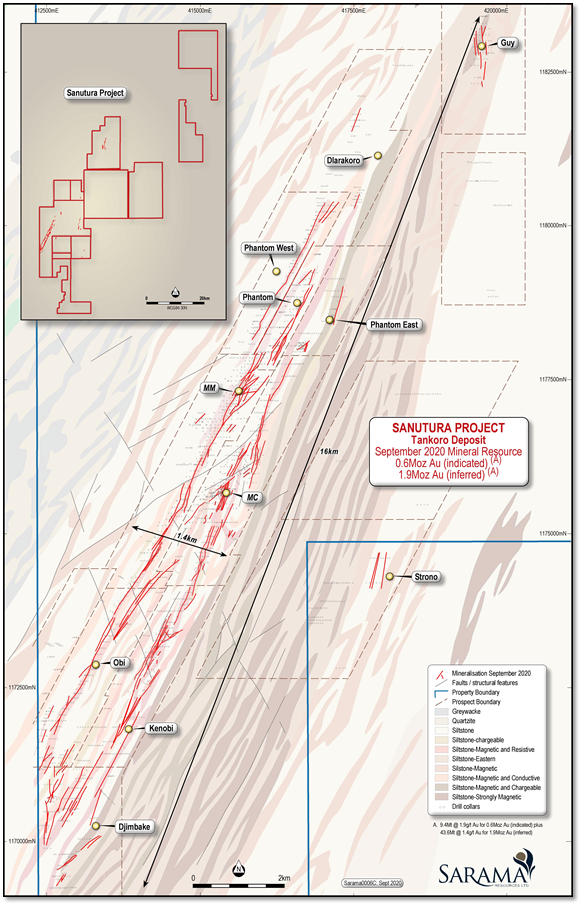
Figure 2 - Tankoro Deposit - Western Corridor Mineralisation Plan
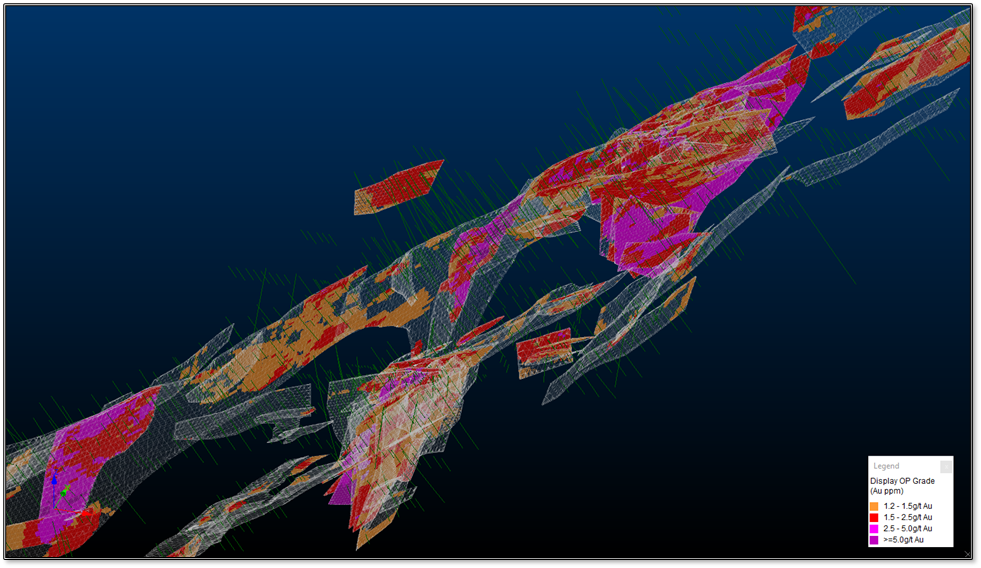
Figure 3 - Higher-Grade Zones Within the Tankoro Deposit (Model Filtered >1.2g/t Au), Isometric View to NW from Above, MM & MC Prospects
ABOUT SARAMA RESOURCES LTD
Sarama Resources Ltd (TSX-V: SWA) is a West African focused gold explorer and developer with substantial landholdings in south-west Burkina Faso. Sarama is focused on maximising the value of its strategic assets and advancing its key projects towards development.
Sarama's Sanutura Project, in which the Company holds a 100% interest, is located within the prolific Houndé and Boromo Greenstone Belts in south-west Burkina Faso and is the exploration and development focus of the Company. Its exploration programs have successfully discovered a mineral resource of 0.6Moz gold (indicated) and 1.9Moz gold (inferred)(1) which is complemented by the Bondi Deposit(7,9) (historical estimate of mineral resources of 0.3Moz Au measured and indicated and 0.1Moz Au inferred(7).
Together, the deposits present a potential development option for a central processing facility fed from multiple sources and principally from the Company's Sanutura Project.
Sarama has built further optionality into its portfolio including a 600km² exploration position in the highly prospective Banfora Belt in south-western Burkina Faso. The Koumandara Project hosts several regional-scale structural features and trends of gold-in-soil anomalism extending for over 40km along strike.
Sarama also holds approximately 20% participating interest in the Karankasso Project Joint Venture ("JV") which is situated adjacent to the Company's Sanutura Project in Burkina Faso and is a JV between Sarama and Endeavour Mining Corp ("Endeavour") in which Endeavour is the operator of the JV. In February 2020, an updated mineral resource estimate of 709koz gold(8) was declared for the Karankasso Project JV.
The Company's Board and management team have a proven track record in Africa and a strong history in the discovery and development of large-scale gold deposits. Sarama is well positioned to build on its current success with a sound strategy to surface and maximise the value of its property portfolio.
FOOTNOTES
1. Current mineral resource estimate - 9.4Mt @ 1.9g/t Au for 0.6Moz Au (indicated) plus 43.6Mt @ 1.4g/t Au for 1.9Moz (inferred), reported at cut-off grades ranging 0.2-1.6g/t Au, reflecting the mining methods and processing flowsheets assumed to assess the liklihood of the mineral resources to have reasonable prospects for eventual economic extraction. The effective date of the Company's inferred mineral resource estimate is September 8, 2020. A technical report will be filed within 45 days of the date of this news release and will be available under the Company's profile on SEDAR at www.sedar.com
2. Previous 2016 mineral resource estimate - 43.0Mt @ 1.5g/t Au (reported above cut-off grades ranging 0.3-2.2g/t Au, reflecting the mining methods and processing flowsheets assumed to assess the likelihood of the inferred mineral resources having reasonable prospects for eventual economic extraction). This mineral resource contains an oxide and transition component of 16.0Mt @ 1.2g/t Au for 611koz Au (reported at a cut-off grade of 0.3g/t Au for oxide and 0.8g/t Au for transition material). The effective date of the Company's inferred mineral resource estimate is February 4, 2016. For further information regarding the mineral resource estimate please refer to the technical report titled "NI 43-101 Independent Technical Report South Houndé Project Update, Bougouriba and Ioba Provinces, Burkina Faso", dated March 31, 2016 and prepared by Adrian Shepherd. Adrian Shepherd is an employee of Cube Consulting Pty Ltd and is considered to be independent of Sarama. The technical report is available under Sarama's profile on SEDAR at www.sedar.com.
3. Higher grade component of the current mineral resource - 6.3Mt @ 2.5g/t Au for 0.5Moz Au (indicated) plus 24.7Mt @ 1.8g/t Au for 1.5Moz (inferred) reported at a cut-off grade of 1.0g/t Au for all material types.
4. Oxide & transition component of the current mineral resource - 3.2Mt @ 1.6g/t Au for 0.2Moz Au (indicated) plus 20.1Mt @ 1.0g/t Au for 0.7Moz Au (inferred), reported above cut-off grades of 0.2g/t Au and 0.3g/t Au for oxide and transition material respectively.
5. Exploration target expressed as a +/-10% range of modelled and estimated mineralisation of 3.1Mt @ 1.1g/t Au for 113koz Au (open pit) and 0.8Mt @ 2.0g/t Au for 53koz Au (underground) reported at cut-off grades of 0.5g/t Au and 1.6g/t Au respectively. This material has low geological, spatial and estimate conficence and cannot be considered as a mineral resource, but is contained within the open pit and undergound mining shapes used to constrain the reported mineral resource.
6. Exploration target expressed as a +/-10% range of modelled and estimated mineralisation of 13.4Mt @ 1.3g/t for 0.6Moz Au reported at a cut-off grade of 1.0g/t Au. This material encompasses all weathering types and all geological classifications and is located outside the constraining open pit shells and underground blockouts used to categorise the modelled mineralisation as having reasonable prospects for eventual economic extraction.
7. Bondi Deposit - 4.1Mt @ 2.1g/t Au for 282,000oz Au (measured and indicated) plus 2.5Mt @ 1.8g/t Au for 149,700oz Au (inferred), reported at a 0.5 g/t Au cut-off.
i. The historical estimate of the Bondi Deposit reflects a mineral resource estimate compiled by Orezone Gold Corporation ("Orezone") and has an effective date of February 20, 2009. The historical estimate is contained in a technical report titled "Technical Report on the Mineral Resource of the Bondigui Gold Project", dated date of February 20, 2009 and prepared by Yves Buro (the "Bondi Technical Report"). Yves Buro is an employee of Met-Chem Canada Inc and is independent of Orezone and Sarama. The technical report is available under Orezone's profile on SEDAR at www.sedar.com
ii. Sarama believes that the historical estimate is relevant to investors' understanding of the property, as it reflects the most recent and substantive technical work undertaken in respect of the Bondi Deposit.
iii. The historical estimate was informed by 886 drillholes, assayed for gold by cyanidation methods, which were used to interpret mineralised envelopes and geological zones over the area of the historical estimate. Gold grade interpolation was undertaken using ID² methodology based on input parameters derived from geostatistical and geological analyses assessments. Field measurements and geological logging of drillholes were used to determine weathering boundaries and bulk densities for modelled blocks.
iv. The historical estimate uses the mineral resource reporting categories required under National Instrument 43-101.
v. No more recent estimates of the mineral resource or other data are available.
vi. Sarama is currently undertaking the necessary verification work in the field and on the desktop that may support the future reclassification of the historical estimate to a mineral resource.
vii. A qualified person engaged by Sarama has not undertaken sufficient work to verify the historical estimate as a current mineral resource and Sarama is therefore not treating the historical estimate as a current mineral resource.
8. Karankasso Project current mineral resource estimate - the current mineral resource estimate for the Karankasso Project of 12.74Mt @ 1.73g/t Au for 709koz Au (effective date of December 31, 2019) was disclosed on February 24, 2020 by Semafo Inc ("Semafo", since acquired by Endeavour Mining Corp. "Endeavour"). For further information regarding that mineral resource estimate, refer to the news release "Semafo: Bantou Project Inferred Resources Increase to 2.2Moz" dated February 24, 2020 and Semafo: Bantou Project NI43-101 Technical Report - Mineral Resource Estimate" dated April 3, 2020. The news release and technical report are available under Semafo's and Endeavour's profile on SEDAR at www.sedar.com. The mineral resource estimate was fully prepared by, or under the supervision of Semafo. Sarama has not independently verified Semafo's mineral resource estimate and takes no responsibility for its accuracy. Semafo, and now Endeavour, is the operator of the Karankasso Project JV and Sarama is relying on their Qualified Persons' assurance of the validity of the mineral resource estimate. Additional technical work has been undertaken on the Karankasso Project since the effective date but Sarama is not in a position to quantify the impact of this additional work on the mineral resource estimate referred to above.
9. The Djarkadougou Exploration Permit, which hosts the Bondi Deposit, is going through a process with the government of Burkina Faso where it is required it be re-issued as a new full-term exploration permit. The Company is in discussion with senior government officials regarding certain impediments to the re-issue of the Exploration Permit and anticipates these discussions will be completed in due course, though there can be no assurance that the process will be successfully completed on a timely basis, or at all.
CAUTION REGARDING FORWARD LOOKING INFORMATION
Information in this news release that is not a statement of historical fact constitutes forward-looking information. Such forward-looking information includes, but is not limited to, the updated mineral resource estimate and the timing of the filing of the new technical report, statements regarding the Company's future exploration and development plans, the potential for the Sanutura and Karankasso Projects to host economic mineralisation, the potential for open pit and underground mining at the Sanutura Project, the potential to expand the present oxide component of the existing estimated mineral resources at the Sanutura Project, the reliability of the historical estimate of mineral resources at the Bondi Deposit, the potential for the receipt of regulatory approvals and the timing and prospects for the re-issuance of the Djarkadougou Exploration Permit by the Government of Burkina Faso. Actual results, performance or achievements of the Company may vary from the results suggested by such forward-looking statements due to known and unknown risks, uncertainties and other factors. Such factors include, among others, that the business of exploration for gold and other precious minerals involves a high degree of risk and is highly speculative in nature; mineral resources are not mineral reserves, they do not have demonstrated economic viability, and there is no certainty that they can be upgraded to mineral reserves through continued exploration; few properties that are explored are ultimately developed into producing mines; geological factors; the actual results of current and future exploration; changes in project parameters as plans continue to be evaluated, as well as those factors disclosed in the Company's publicly filed documents.
licensing or approvals will be obtained. However, the Company believes that the assumptions and expectations reflected in the forward-looking information are reasonable. Assumptions have been made regarding, among other things, the Company's ability to carry on its exploration activities, the sufficiency of funding, the timely receipt of required approvals, the price of gold and other precious metals, that the Company will not be affected by adverse political events, the ability of the Company to operate in a safe, efficient and effective manner and the ability of the Company to obtain further financing as and when required and on reasonable terms. Readers should not place undue reliance on forward-looking information.
Sarama does not undertake to update any forward-looking information, except as required by applicable laws.
QUALIFIED PERSONS' STATEMENT
Scientific or technical information in this news release that relates to the preparation of the Company's mineral resource estimate for the Tankoro Deposit within the Sanutura Project is based on information compiled or approved by Adrian Shepherd. Adrian Shepherd is an employee of Cube Consulting Pty Ltd and is considered to be independent of Sarama Resources Ltd. Adrian Shepherd is a Chartered Professional Member in good standing of the Australasian Institute of Mining and Metallurgy and has sufficient experience which is relevant to the commodity, style of mineralisation under consideration and activity which he is undertaking to qualify as a Qualified Person under National Instrument 43-101. Adrian Shepherd consents to the inclusion in this news release of the information, in the form and context in which it appears.
Scientific or technical information in this news release that relates to tank-based and oxidative metallurgical testwork and mineral processing is based on information compiled or approved by Fred Kock. Fred Kock is an employee of Orway Mineral Consultants Pty Ltd and is considered to be independent of Sarama Resources Ltd. Fred Kock is a Fellow in good standing of the Australasian Institute of Mining and Metallurgy and has sufficient experience which is relevant to the commodity, style of mineralisation under consideration and activity which he is undertaking to qualify as a Qualified Person under National Instrument 43-101. Fred Kock consents to the inclusion in this news release of the information, in the form and context in which it appears.
Scientific or technical information in this disclosure, in respect of the Bondi Deposit relating to mineral resource and exploration information drawn from the Technical Report prepared for Orezone on that deposit has been approved by Guy Scherrer. Guy Scherrer is an employee of Sarama Resources Ltd and is a member in good standing of the Ordre des Géologues du Québec and has sufficient experience which is relevant to the commodity, style of mineralisation under consideration and activity which he is undertaking to qualify as a Qualified Person under National Instrument 43-101. Guy Scherrer consents to the inclusion in this disclosure of the information, in the form and context in which it appears.
Scientific or technical information in this disclosure that relates to the quotation of the Karankasso Project's mineral resource estimate and exploration activities is based on information compiled by Paul Schmiede. Paul Schmiede is an employee of Sarama Resources Ltd and is a Fellow in good standing of the Australasian Institute of Mining and Metallurgy. Paul Schmiede has sufficient experience which is relevant to the commodity, style of mineralisation under consideration and activity which he is undertaking to qualify as a Qualified Person under National Instrument 43-101. Paul Schmiede consents to the inclusion in this disclosure of the information, in the form and context in which it appears. Paul Schmiede and Sarama have not independently verified Semafo's (now Endeavour's) mineral resource estimate and take no responsibility for its accuracy.
Neither TSX Venture Exchange nor its Regulation Services Provider (as that term is defined in policies of the TSX Venture Exchange) accepts responsibility for the adequacy or accuracy of this release.
APPENDIX A - MINERAL RESOURCE ESTIMATION
- The mineral resource estimate was undertaken by Cube Consulting Pty Ltd ("Cube"), a minerals industry consultancy based in Perth, Western Australia, which is independent of Sarama.
- The 12 prospect areas that are the subject of this mineral resource are located on the Tankoro and Ouangoro 2 exploration properties and the validated mineral resource drilling database contained the following drillhole physicals that were used directly in the modelling of the mineral inventory: 600 air-core ("AC") drillholes (34,216m), 568 reverse-circulation ("RC") drillholes (60,546m), 75 full length diamond drillholes (21,296m) and a further 103 diamond drillhole tails (15,411m) that were extensions to previously drilled RC holes.
- The mineral resource estimate used only diamond, RC and AC drilling data.
- The drilling was completed in several phases by Sarama and Acacia Mining plc between 7th June 2011 and 6th July 2019.
- Drilling was generally oriented on west-east lines, with a range of drill-line spacings used depending on geological complexity and the intent of the drill programs. Interpretations of mineralisation were made with drill fence spacing varying from approximately 25m to 600m, however areas of excessive drill spacing remain geologically ‘unclassified' and do not contribute to the mineral resource. Within the lodes contributing to the mineral resource, drill spacing varies from 25-230m and is typically 50-100m.
- Collars for drillholes used in the mineral resource estimate have been surveyed using a differential GPS system which is considered to provide a location accuracy of <10cm horizontally and <15cm vertically.
- Downhole surveys have been conducted on all diamond and RC holes using either magnetic single-shot or gyro multi-shot electronic survey instruments. No downhole surveys were conducted on AC drillholes.
- Geological logging of drillholes includes state of weathering, lithology, alteration, mineralogy, structural defects and groundwater conditions. All drillhole logging data was compiled into a master drilling database.
- AC and RC drilling was logged and sampled over regular 1m intervals for the entire hole, whilst diamond holes were logged and sampled over varying intervals (average 0.9m sample length) according to geological observations. In the case of diamond drilling, samples submitted for assay were half-core. In the case of AC drilling, some sampled intervals were composited over 2m for initial assaying with the initial 1m constituents of the composites subsequently re-assays in areas proximal to mineralisation.
- Diamond drilling had length-weighted average core recoveries of 97%, with approximately 1.3% of mineralized samples (>0.1g/t Au) having core recoveries of less than 50%. Sample weight data is available for 26,538m of AC drilling (or 78% of total AC drill metres used directly in the mineral resource estimate) and had an average sample collection rate of 9kg/m. Sample weight data is available for 60,378m of RC drilling (or 99% of total RC drill metres used directly in the mineral resource estimate) and had an average sample collection rate of 23kg/m. Localised zones of poor AC and RC sample recovery and quality caused by wet drilling conditions were assessed on an individual basis to determine the suitability for inclusion in the mineral resource estimation as in many cases were excluded.
- AC and RC sample splitting was performed at Sarama's preparation facilities in Burkina Faso. In the case of wet AC and RC drilling, full samples were dried by wood-fire prior to splitting. Diamond core sawing was also undertaken at Sarama's preparation facility.
- Sampling and sample submission were conducted in accordance with a quality assurance/quality control program which includes the use of certified reference materials for diamond, RC and AC drilling and field duplicates for AC and RC drilling.
- All drilling samples are securely bagged at the preparation facility and assigned sample identification numbers prior to their transport to assay laboratories in Burkina Faso and Mali operated by SGS SA, Activation Laboratories Ltd, ALS Limited and Bigs Global to international standards.
- Gold content is determined by fire assay methods using a 50g charge, lead collection and an atomic absorption spectroscopy finish. Assay methods have a lower detection limit of at least 0.01 g/t Au.
- Structure, lithology, alteration, mineralisation, weathering and surface topography surfaces were interpreted in 3D by Cube using Seequent Leapfrog GeoTM and GEOVIA SurpacTM software.
- Lithological, structural and alteration information from drillhole logging was primarily used to develop interpretations of the mineralised domains and gold assays were used as a secondary determinant.
- Mineralised interpretations generally honour a 0.25 g/t Au lower cut-off. The interpretation was typically extended past the last drillhole intercept by 50m to 100m downdip and up to 200m along strike where the geological and grade continuity could be reasonably implied.
- Additional criteria of a minimum 2m downhole interval length, and the minimisation of internal dilution were considered during the interpretation of the mineralised domains. However, internal dilution was incorporated where required to preserve the overall continuity of the mineralised domains.
- The mineralisation interpretation consists of 205 individual domains, defined by lithological, weathering and spatial characteristics. Continuous mineralisation domains are visually robust and consistent across a range of cut-offs from zero to 1.0 g/t Au. In certain zones, higher-grade sub-domains were modelled to better reflect the occurrence of higher-grade mineralisation within a broader mineralized lode.
- The vertical extent of the reported mineral resources varies across the individual prospects with approximate vertical depths as follows: MM - 540m, MC - 470m, Phantom - 240m, Phantom East - 140m; Phantom West - 240m, Obi - 90m and Kenbobi - 80m, Djimbake, - 50m, Guy - 90m, Dlarakoro - 80m, Legbenege - 35m and Poggle - 20m.
- For the purposes of density measurement, a total of 4,389 samples were collected from drilling across the prospects hosting the mineral resource, covering all weathering types and representative lithologies. A density value was then assigned for each weathering types and representative lithologies in the mineral resource estimate.
- Downhole composites of 1m were extracted from the assay database based on the mineralised wireframes and form the basis for statistical analysis, variography and grade interpolation.
- Gold assays were reviewed on an individual domain basis to determine appropriate top-cuts for each domain to reduce the influence of grade outliers. The top-cuts that were applied to selected domains were all above the 95th grade percentile. In general, the grade domains represent distinct geological and statistical populations and provide a robust basis for mineral resource estimation.
- Variography was completed to analyse the spatial continuity of the grade within the major mineralised domains using ISATIS® software. A total of 5 super-domains were selected for analysis to characterise the grade continuity for grade interpolation. The domains were selected based on them being well informed by drilling data, hosting the largest mineralised volumes and being representative of the main host lithology types and their spatial distribution across and along the mineralised trends. The resultant variogram models were used to determine the appropriate estimation parameters for grade interpolation into the block model for individual mineralised domains.
- GEOVIA SurpacTM software was used to perform the grade estimation into 2 block models (one for the western mineralised trend and one for the eastern mineralised trend within the Project). Ordinary-kriging and inverse distance (ID2) methodologies were used for the western and eastern trend estimates respectively. All block estimates were based on grade interpolation into parent cells with dimensions of 5m x 25m x 10m (XYZ) for each individual mineralised domain. In order to better approximate the mineralised domains, the block models were aligned on azimuths of N25° and N0° for the western and eastern mineralised trends respectively.
- Three gold grade interpolation passes were completed, where the first pass used the KNA derived parameters, a second pass with the search distance extended to approximately 200m and a final pass with the minimum samples reduced to two (2). All blocks unestimated after the third pass were assigned a value of 0.0001g/t Au and categorised as unclassified. Assigned block grades accounted for less than 0.1% of the total mineralised volume.
- Upon completion of the block model, swath plots were generated to compare the gold grades estimated for the blocks against composited raw gold grades on easting, northing and elevation on 10m, 50m and 20m spacings for all mineralised domains. The block model was further validated by conducting an ‘inverse-distance-squared' estimate for comparison (total contained gold was within 2% for the two estimates, indicating no systematic bias in the mineral resource estimate).
- The block model was classified as ‘indicated', ‘inferred' and ‘unclassified' according to geological and estimate confidence. Consideration was given to data density, geological and grade continuity, drill spacing, drill quality, material type, suitability of estimation methodology and local estimation bias.
- Modelled mineralisation was assessed for likelihood to have reasonable prospects of eventual economic extraction by generating open pit optimisation shells and underground mining blockouts. Open pit optimisations, based on the Lerchs-Grossmann algorithm, were conducted using GEOVIA WhittleTM software with assumed input parameters for gold price, metallurgical recovery, operating costs and pit wall angles. The US$1800/oz shell was selected to constrain the modelled mineralisation for reporting purposes. Modelled mineralisation in fresh material located beneath the extent of the open pit shell was assessed for potential suitability for underground mining using cut-off grade, strike and dip continuity, minimum mining width, minimum stope height, spatial distribution of blocks and pit/underground interaction criteria. 3D wireframes were generated on a lode-by-lode basis for modelled blocks meeting all criteria. Blocks captured within either the open pit or underground constraining mining shapes were flagged.
- Blocks flagged by the mining shape constraints were interrogated by a range of cut-off grades (by material type, by potential mining style) to report final mineral resources. The inputs for the calculation of the reporting cut-off grades reflected those inputs used for the generation of the constraining mining shapes. Mineralised material categorised geologically as ‘unclassified' was excluded from the reporting of mineral resources.
- The resulting mineral resource estimate is compliant with the requirements of Canadian National Instrument 43-101, 2016 ("NI-43-101") and the Australasian Code for Reporting of Exploration Results, Mineral Resources and Ore Reserves, 2012 ("The JORC Code").
- The final block model included the estimated mineralised domains with attributes for prospect, weathering type, lithology, density, estimation domain code, geological classification, constraining flag for open pit and underground mining shapes and a flag for mineral resource.
- Tonnage-grade curves were generated for a range of reporting cut-off grades, material types and by prospect.
Table A1 - Mineral Resources by Prospect (A,B,C,D,E,F)
|
Prospect |
Indicated Mineral Resources |
Inferred Mineral Resources |
||||
|
|
kt |
g/t Au |
koz Au |
kt |
g/t Au |
koz Au |
|
|
|
|
|
|
|
|
|
MM |
6,055 |
2.1 |
437 |
19,056 |
1.6 |
990 |
|
MC |
2,512 |
1.4 |
113 |
9,240 |
1.3 |
389 |
|
Obi |
168 |
2.1 |
11 |
4,483 |
0.8 |
122 |
|
Kenobi |
493 |
1 |
16 |
4,341 |
0.9 |
126 |
|
Djimbake |
- |
- |
- |
817 |
0.8 |
22 |
|
Phantom |
172 |
0.9 |
5 |
2,152 |
1.4 |
96 |
|
Phantom West |
- |
- |
- |
1,425 |
1.5 |
67 |
|
Phantom East |
- |
- |
- |
587 |
2.1 |
39 |
|
Guy |
- |
- |
- |
920 |
0.7 |
20 |
|
Dlarakoro |
- |
- |
- |
424 |
1.5 |
21 |
|
Legbenege |
- |
- |
- |
108 |
0.8 |
3 |
|
Poggle |
- |
- |
- |
29 |
0.6 |
1 |
|
|
|
|
|
|
|
|
Table Notes
A. Mineral resources are not mineral reserves and do not demonstrate economic viability.
B. All tonnage, grade and ounces have been rounded and minor discrepancies in additive totals may occur.
C. Mineral resources are reported as a mining shape-constrained subset of the modelled mineral inventory following assessment for ‘reasonable prospects for eventual economic extraction' by the generation of open pit optimisation shells ("OP") and underground mining blockouts ("UG"). The assessment and is not supported by a preliminary economic assessment or a feasibility study and the geological classification and reporting categorisations do not imply that mineral resources demonstrate economic viability.
D. Cut-off grades were determined using a gold price of US$1800/oz, metallurgical recoveries supported by testwork and based on oxide material being processed by a CIL flowsheet and transition and fresh material being processed by a flotation+BIOX®+CIL flowsheet and operating cost assumptions for mining, processing and G&A activities considered appropriate for the anticipated configuration of a potential development at the Project.
E. Oxide and transition material reported at a cut-off grade of 0.2g/t Au and 0.3g/t Au respectively.
F. Fresh material at the Guy, Legbenege and Poggle Prospects is assumed to be free-milling and reported at a cut-off grade of 0.3g/t Au. All other OP fresh mineral resources reported at a cut-off grade of 0.5g/t Au.
Table A2 - Sensitivity of Mineral Resource Estimate (A,B) Grade & Tonnage to Cut-Off Grade - All Prospects
|
Oxide |
Transition |
Fresh |
|||||||
|
Cut-Off Grade |
Tonnage |
Average Grade |
Contained Gold |
Tonnage |
Average Grade |
Contained Gold |
Tonnage |
Average Grade |
Contained Gold |
|
OP Indicated(C,D) |
Mt |
g/t Au |
koz Au |
Mt |
g/t Au |
koz Au |
Mt |
g/t Au |
koz Au |
|
0 |
2.5 |
1.5 |
124 |
0.7 |
1.7 |
38 |
6.7 |
2.0 |
417 |
|
0.2 |
2.5 |
1.5 |
123 |
0.7 |
1.7 |
38 |
6.7 |
2.0 |
417 |
|
0.3 |
2.5 |
1.5 |
123 |
0.7 |
1.7 |
38 |
6.6 |
2.0 |
417 |
|
0.4 |
2.5 |
1.6 |
123 |
0.7 |
1.7 |
37 |
6.4 |
2.0 |
415 |
|
0.5 |
2.4 |
1.6 |
122 |
0.7 |
1.7 |
37 |
6.1 |
2.1 |
409 |
|
1.0 |
1.6 |
2.0 |
102 |
0.4 |
2.3 |
31 |
4.1 |
2.7 |
362 |
|
1.5 |
0.9 |
2.6 |
72 |
0.3 |
3.0 |
24 |
2.9 |
3.4 |
312 |
|
OP Inferred(C,D) |
|||||||||
|
0 |
16.7 |
1.0 |
548 |
3.3 |
1.1 |
115 |
20.5 |
1.4 |
929 |
|
0.2 |
16.7 |
1.0 |
548 |
3.3 |
1.1 |
115 |
20.5 |
1.4 |
929 |
|
0.3 |
16.5 |
1.0 |
546 |
3.3 |
1.1 |
115 |
20.5 |
1.4 |
929 |
|
0.4 |
15.9 |
1.1 |
540 |
3.3 |
1.1 |
114 |
20.3 |
1.4 |
927 |
|
0.5 |
14.9 |
1.1 |
524 |
3.2 |
1.1 |
113 |
20.1 |
1.4 |
923 |
|
1.0 |
6.0 |
1.6 |
311 |
1.4 |
1.6 |
69 |
13.7 |
1.7 |
763 |
|
1.5 |
2.5 |
2.2 |
178 |
0.5 |
2.2 |
35 |
6.3 |
2.3 |
472 |
|
UG Indicated(C,D) |
Mt |
g/t Au |
koz Au |
Mt |
g/t Au |
koz Au |
Mt |
g/t Au |
koz Au |
|
0 |
- |
- |
- |
- |
- |
- |
0.3 |
1.4 |
15 |
|
1.6 |
- |
- |
- |
- |
- |
- |
0.1 |
2.4 |
11 |
|
2.5 |
- |
- |
- |
- |
- |
- |
0.1 |
3.0 |
5 |
|
3.5 |
- |
- |
- |
- |
- |
- |
- |
- |
- |
|
5.0 |
- |
- |
- |
- |
- |
- |
- |
- |
- |
|
UG Inferred(C,D) |
|||||||||
|
0 |
- |
- |
- |
- |
- |
- |
4.5 |
2.3 |
330 |
|
1.6 |
- |
- |
- |
- |
- |
- |
3.4 |
2.8 |
305 |
|
2.5 |
- |
- |
- |
- |
- |
- |
1.9 |
3.4 |
207 |
|
3.5 |
- |
- |
- |
- |
- |
- |
0.5 |
4.8 |
84 |
|
5.0 |
- |
- |
- |
- |
- |
- |
0.2 |
5.9 |
37 |
Table Notes
A. Mineral resources are not mineral reserves and do not demonstrate economic viability.
B. All tonnage, grade and ounces have been rounded and minor discrepancies in additive totals may occur.
C. Mineral resources are reported as a mining shape-constrained subset of the modelled mineral inventory following assessment for ‘reasonable prospects for eventual economic extraction' by the generation of open pit optimisation shells ("OP") and underground mining blockouts ("UG"). The assessment and is not supported by a preliminary economic assessment or a feasibility study and the geological classification and reporting categorisations do not imply that mineral resources demonstrate economic viability. OP and UG constrained mineral resources are exclusive of eachother.
D. Constraining mining shapes were generated using a gold price of US$1800/oz, metallurgical recoveries supported by testwork and based on oxide material being processed by a CIL flowsheet and transition and fresh material being processed by a flotation+BIOX®+CIL flowsheet and operating cost assumptions for mining, processing and G&A activities considered appropriate for the anticipated configuration of a potential development at the Project.
APPENDIX B - 2016 MINERAL RESOURCE ESTIMATE
Table B.1 - 2016 Inferred Mineral Resource(A,B) - All Prospects
|
Depth Below Surface3,4 |
Material Type5 |
Reporting Cut-off Grade6 |
Tonnage Above Cut-off Grade |
Average Grade Above Cut-off Grade |
Contained Gold Above Cut-off Grade |
Metal Contribution |
|
g/t Au |
Mt |
g/t Au |
koz Au |
|||
|
0-200m |
Oxide |
0.3 |
13.5 |
1.2 |
498 |
24% |
|
Transition |
0.8 |
2.5 |
1.4 |
113 |
5% |
|
|
Fresh |
0.8 |
25.0 |
1.5 |
1,237 |
59% |
|
|
Sub-total |
41.0 |
1.4 |
1,849 |
88% |
||
|
>200m |
Fresh |
2.2 |
2.0 |
3.9 |
250 |
12% |
|
Total Mineral Resource |
43.0 |
1.5 |
2,099 |
100% |
||
Table Notes
A. Mineral resources are not mineral reserves and do not demonstrate economic viability.
B. All tonnage, grade and ounces have been rounded and minor discrepancies in additive totals may occur.
C. Depth below surface classification used as a guide to assess the modelled minerslisation for likelihood of reasonable prospects of eventual economic extraction and is not supported by a preliminary economic assessment or a feasibility study. The classification does not imply that mineral resources demonstrate economic viability.
D. Mineral resources reported above and below 140mRL, corresponding to a depth of approximately 200m below surface.
E. Weathering classification is based on visual assessment of drill core and cuttings by geologists and does not represent a definitive geo-metallurgical classification.
F. Cut-off grades were determined using a gold price of US$1500/oz, metallurgical recoveries supported by testwork and based on oxide material being processed by heap leach flowsheet and fresh and transition material being processed by a flotation+BIOX®+CIL flowsheet.
SOURCE: Sarama Resources Ltd.