


BAR HARBOR, ME / ACCESSWIRE / April 30, 2020 / Bar Harbor Bankshares (NYSE American:BHB) reported first quarter 202 net income of $7.7 million or $0.50 per share, a 6% increase in net income over the same quarter of 2019 of $7.3 million or $0.47 per share.
FIRST QUARTER FINANCIAL HIGHLIGHTS (compared to the first quarter of 2019, unless otherwise noted)
- 6% annualized growth in commercial loans
- 10% annualized growth in non-maturity deposits
- 99% loan to deposit ratio, improved from 102%
- 3.06% net interest margin compared to 2.77%
- 37% increase in non-interest income
- 0.38% non-accruing loans to total loans compared to 0.66%
President and Chief Executive Officer, Curtis C. Simard stated, "While our financial performance in the first quarter was strong, our efforts have shifted rather quickly with the COVID 19 developments. Our team has been fully dedicated to supporting our customers, colleagues, friends and families during these difficult times and I am proud of the accomplishments being achieved every day. It's through adversity that we elevate the strength of our culture and further educate our customers about the strength of our Company's operating model."
"Although we are focused on the challenges posed by the health crisis, we remain committed to what has always been a cornerstone of our business operations: Risk management, ranging from underwriting practices to what is now at the forefront, crisis management and business continuity planning. Our ability to navigate during these uncertain times has been tested and proven successful as we continue to proactively work with customers, both large and small, as well as support our dedicated colleagues. From the onset, we've maintained open communication with customers and employees alike, as we transitioned to a mostly remote working environment. This transition was very smooth given the readiness of our information technology and operations teams. We modified our branch model to provide for the safety of our customers and colleagues, while balancing a personalized touch to meet the needs of our customers. That includes transitioning to mostly drive-up and walk-up windows along with in person meetings by appointment when necessary. The investments we've made in the past few years in online and mobile banking platforms have also been essential with the current environment helping accelerate adoption rates."
Mr. Simard further stated, "Despite our focus on the current environment, we have not lost sight of our long-term goals. Recognizing the importance of liquidity, we have opportunistically and appropriately utilized many of the various federal programs in an effort to insulate ourselves from potential risk and uncertainty. As you may recall in the fourth quarter of 2019 we refinanced and upsized our subordinated debt, which has further supported capital levels and the balance sheet. The lending teams outperformed this quarter as they kept pace with originations offsetting elevated payoff levels as typically seen with the lower rate environment. The growth in commercial loans offset the decrease in our residential portfolio as we strategically moved most of our production to the secondary market. The teams have also successfully rolled out the Small Business Administration (SBA) Paycheck Protection Program (PPP) in an effort to help our business partners and support our communities. To date we have over 1,500 PPP loans approved by the SBA with a total balance of $127 million. In addition, we also modified close to 500 existing loans, representing $271 million in balances. The loans modified under deferment plans are still accruing interest and all contractual principal and interest is expected to be collected."
Mr. Simard continued, "Our loan portfolio remains diverse with over 80 different industries and several geographies limiting concentration risk, which is further mitigated by the specific type and strength of the borrowers. These credit relationships are proven successful operators in their industry and have weathered difficult economic times in the past. We continue to carefully review opportunities with these proven borrowers while also stress testing the portfolio regularly."
"Given the recently passed CARES Act, we have elected to defer the new accounting for the allowance for loan losses known as "CECL" to prioritize resources around our customers and communities. That said, we increased the allowance for credit losses during the quarter due to elevated qualitative economic factors at quarter end. Additionally, our liquidity, capital ratios and overall balance sheet position are strong. Our wholesale borrowing reliance is further declining and our ability to access wholesale funding at fair pricing is at an all-time high."
Mr. Simard concluded, "Moving forward in 2020, we are executing strategies that will benefit our long-term profitability while being mindful of the short-term challenges and operating environment. Lower interest rates and the divergence in FHLB borrowings and brokered deposit spreads has provided us with an opportunity to lock into favorable rates with longer maturities. The benefits of these activities, along with the balance sheet strategies executed last year, are unveiled as we see the net interest margin expand nearly 30 basis points during the quarter. Non-interest income is also up for the quarter as we continue to provide hedging transactions to help meet our customers' needs. And while trust and investment management fee income is up significantly over prior year, it is also sensitive to market conditions and could vary as market dynamics persist with the pandemic. In summary, our teams are focused on activities that create value for long-term shareholders and the Company continues to build tangible book value at a quarterly annualized rate of close to 10%."
FINANCIAL CONDITION
Total assets were $3.7 billion and remained relatively flat with the fourth quarter of 2019. In anticipation of customer demand given their potential liquidity needs, cash increased $28.7 million as additional reserves were established. Securities declined $36.9 million as the Company continued to de-lever and remix the investment portfolio during the first of quarter. Loan balances in the first quarter 2020 were $2.6 billion, flat with the fourth quarter 2019. Total commercial loans grew at an annualized rate of 6% led by commercial real estate with an annualized growth rate of 8%. Residential real estate loans were relatively flat with the fourth quarter as most production was funneled through the secondary market platform. Payoff activity was experienced across all products lines as borrowers refinanced given the lower rate environment. The product mix of total commercial loans remains diversified among several hundred industries and over many geographic regions.
As of March 31, 2020, the loan portfolio consists of the following (in millions):
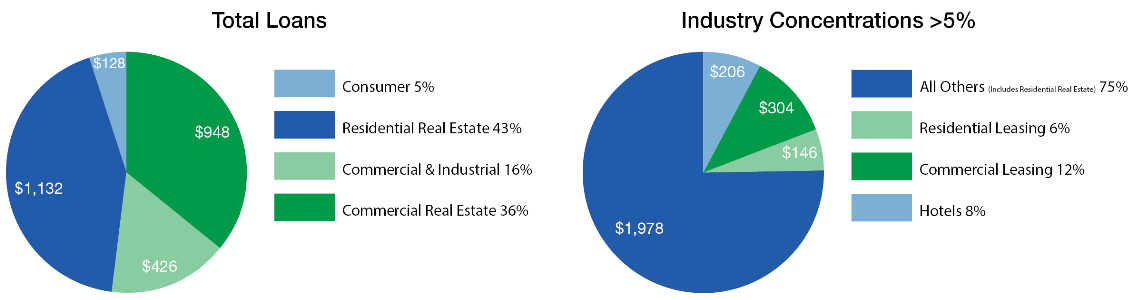
In the first quarter 2020, the Company elected to defer implementation of CECL as allowed under the CARES Act in an effort to prioritize resources around the various debt and government relief programs. As result, the Company continues to operate its incurred loss model, which has been adjusted to reflect current economic conditions increasing the allowance for loan loss. That increase has been offset by an improvement in other credit quality factors including several specifically reserved loans that were settled at approximate book value. The allowance for loan losses to total loans ratio for the first quarter remains at 0.58% with a coverage ratio to non-accruing loans at 152%, up from 133% as of year-end. Past due accounts between 30 to 89 days as a percentage of total loans was 0.84% for the first quarter compared to 0.74% at year-end 2019. The majority of the customers in that range have a history of making payments on a cycle that is about 30 days overdue and is not likely an indication of deteriorated credit quality.
The Company's liquidity position remains strong. At March 31, 2020, same day available liquidity totaled approximately $1.2 billion, including cash, borrowing capacity at the Federal Home Loan Bank of Boston (FHLB) and the Federal Reserve Discount Window and various lines of credit. Additional sources of liquidity include cash flows from operations, wholesale deposits, cash flow from the Company's amortizing securities and loan portfolios. At March 31, 2020, the Company had unused borrowing capacity at the FHLB of $539 million, unused borrowing capacity at the Federal Reserve of $27 million and unused lines of credit totaling $51 million. The Company utilized the Federal Reserve's Paycheck Protection Program Liquidity Facility to provide liquidity to fund PPP loans.
The Company's book value per share was $25.90 at the end of the first quarter 2020 compared to $25.48 at year-end 2019. Tangible book value per share (non-GAAP measure) was $17.70 at the end of the first quarter 2020 compared to $17.30 at year-end 2019; an annualized growth rate of 9%. The low interest rate environment continues to have a positive impact on the fair value of the Company's securities portfolio. Other comprehensive income included unrealized gains on securities totaling $9.6 million in the first quarter 2020 compared to $5.6 million at year-end 2019.
RESULTS OF OPERATIONS
Net income in the first quarter 2020 was $7.7 million, or $0.50 per share, compared to $7.3 million, or $0.47 per share, in the same quarter of 2019. Net interest margin in the first quarter 2020 increased to 3.06% from 2.77% in the same period of 2019. The increase is primarily driven by lower borrowing levels as the average balance decreased to $557 million in the first quarter 2020 from $762 million in prior year due to deleveraging strategies executed in late 2019 and a lower cost of funds. The balance sheet strategies executed during the second half of last year along with the rate cuts experienced in the first quarter reduced borrowing rates to 2.10% from 2.74% and interest-bearing deposits rates to 1.08% from 1.25% in the first quarter 2019. The Company continues to optimize its funding sources to take advantage of this lower rate environment through a mixture of various debt and derivative instruments. Yields from earning assets declined to 4.14% from 4.19% in the first quarter 2019 reflecting loan originations and repricing of variable rate products in a lower interest rate environment. The loan to deposit ratio was 99% in the first quarter 2020 as the Company maintained its fourth quarter 2019 deposit levels, which is due to strong customer relationships within its branch model.
The first quarter 2020 provision for loan losses increased to $1.1 million from $324 thousand in the same quarter 2019. As noted above, the Company is maintaining its incurred loss model for calculating the allowance for loan losses. The year-over-year increase in the provision for loan losses is due to qualitative adjustments made to reflect a downward economic trend in the first quarter 2020. Those downward adjustments were offset in part by improvements in other credit quality factors such as charge-off history and underwriting practices. While the impact of the health crisis is uncertain, we believe the existing allowance for loan losses is sufficient to absorb inherent losses based on our disciplined credit approach, experienced losses and methodology, and current review of the portfolio.
Non-interest income in the first quarter 2020 increased 37% to $8.4 million from $6.2 million in the same quarter in 2019. Trust income was $3.4 million in the first quarter 2020, up 22% from the same quarter of 2019 on higher assets under management within an expanded footprint given the branch acquisition which closed in October 2019. Customer service fees also increased significantly to $3.1 million compared to $2.2 million from the same quarter of 2019r due to transaction growth on a higher customer base. Customer loan derivative income also contributed to non-interest income in the first quarter 2020 as demand for these products remains strong within the commercial loan pipeline.
Non-interest expense was $22.4 million in the first quarter 2020 compared to $18.6 million in the same quarter of 2019. The increase is primarily due to higher salary and benefit and occupancy and equipment costs to support the Company's expanded branch model and wealth management business.
BACKGROUND
Bar Harbor Bankshares (NYSE American:BHB) is the parent company of its wholly-owned subsidiary, Bar Harbor Bank & Trust. Founded in 1887, Bar Harbor Bank & Trust is a true community bank serving the financial needs of its clients for over 130 years. Bar Harbor provides full-service community banking with office locations in all three Northern New England states of Maine, New Hampshire and Vermont. For more information, visit www.barharbor.bank.
FORWARD LOOKING STATEMENTS
Certain statements under the heading "FIRST QUARTER FINANCIAL HIGHLIGHTS" contained in this document that are not historical facts may constitute forward-looking statements within the meaning of Section 27A of the Securities Act of 1933, as amended ("Securities Act"), and Section 21E of the Securities Exchange Act of 1934, as amended ("Exchange Act"), and are intended to be covered by the safe harbor provisions of the Private Securities Litigation Reform Act of 1995. When used in this earnings release the words "may," "will," "should," "could," "would," "plan," "potential," "estimate," "project," "believe," "intend," "anticipate," "expect," "target" and similar expressions are intended to identify forward-looking statements, but these terms are not the exclusive means of identifying forward-looking statements. These forward-looking statements are subject to significant risks, assumptions and uncertainties, including among other things, changes in general economic and business conditions, increased competitive pressures, changes in the interest rate environment, legislative and regulatory change, changes in the financial markets, and other risks and uncertainties disclosed from time to time in documents that the Company files with the Securities and Exchange Commission, including but not limited to those discussed in the section titled "Risk Factors" in the Company's Annual Report on Form 10-K for the fiscal year ended December 31, 2019. Because of these and other uncertainties, the Company's actual results, performance or achievements, or industry results, may be materially different from the results indicated by these forward-looking statements. In addition, the Company's past results of operations do not necessarily indicate future results. You should not place undue reliance on any of the forward-looking statements, which speak only as of the dates on which they were made. The Company is not undertaking an obligation to update forward-looking statements, even though its situation may change in the future, except as required under federal securities law. The Company qualifies all of its forward-looking statements by these cautionary statements.
NON-GAAP FINANCIAL MEASURES
This document contains certain non-GAAP financial measures in addition to results presented in accordance with accounting principles generally accepted in the United States of America ("GAAP"). These non-GAAP measures are intended to provide the reader with additional supplemental perspectives on operating results, performance trends, and financial condition. Non-GAAP financial measures are not a substitute for GAAP measures; they should be read and used in conjunction with the Company's GAAP financial information. A reconciliation of non-GAAP financial measures to GAAP measures is provided below. In all cases, it should be understood that non-GAAP measures do not depict amounts that accrue directly to the benefit of shareholders. An item which management excludes when computing non-GAAP core earnings can be of substantial importance to the Company's results for any particular quarter or year. The Company's non-GAAP core earnings information set forth is not necessarily comparable to non- GAAP information which may be presented by other companies. Each non-GAAP measure used by the Company in this report as supplemental financial data should be considered in conjunction with the Company's GAAP financial information.
The Company utilizes the non-GAAP measure of core earnings in evaluating operating trends, including components for core revenue and expense. These measures exclude amounts which the Company views as unrelated to its normalized operations, including gains/losses on securities, premises, equipment and other real estate owned, acquisition costs, restructuring costs, legal settlements, and systems conversion costs. Non-GAAP adjustments are presented net of an adjustment for income tax expense.
The Company also calculates core earnings per share based on its measure of core earnings. The Company views these amounts as important to understanding its operating trends, particularly due to the impact of accounting standards related to acquisition activity. Analysts also rely on these measures in estimating and evaluating the Company's performance. Management also believes that the computation of non-GAAP core earnings and core earnings per share may facilitate the comparison of the Company to other companies in the financial services industry. The Company also adjusts certain equity related measures to exclude intangible assets due to the importance of these measures to the investment community.
###
CONTACTS
Josephine Iannelli; EVP, Chief Financial Officer & Treasurer; (207) 288-3314
|
TABLE |
|
|
INDEX |
CONSOLIDATED FINANCIAL SCHEDULES (UNAUDITED) |
|
A |
Selected Financial Highlights |
|
B |
Footnotes to Selected Financial Highlights |
|
C |
Balance Sheets |
|
D |
Loan and Deposit Analysis |
|
E |
Statements of Income |
|
F |
Statements of Income (Five Quarter Trend) |
|
G |
Average Yields and Costs |
|
H |
Average Balances |
|
I |
Asset Quality Analysis |
|
J |
Reconciliation of Non-GAAP Financial Measures (Five Quarter Trend) and Supplementary Data |
BAR HARBOR BANKSHARES
SELECTED FINANCIAL HIGHLIGHTS - UNAUDITED
|
|
At or for the Quarters Ended | |||||||||||||||||||
|
|
Mar 31, | Dec 31, | Sep 30, | Jun 30, | Mar 31, | |||||||||||||||
|
|
2020 | 2019 | 2019 | 2019 | 2019 | |||||||||||||||
|
PER SHARE DATA
|
||||||||||||||||||||
|
Net earnings, diluted
|
$ | 0.50 | $ | 0.27 | $ | 0.32 | $ | 0.39 | $ | 0.47 | ||||||||||
|
Core earnings, diluted (1) (2)
|
0.50 | 0.56 | 0.47 | 0.41 | 0.47 | |||||||||||||||
|
Total book value
|
25.90 | 25.48 | 25.37 | 25.13 | 24.54 | |||||||||||||||
|
Tangible book value (2)
|
17.70 | 17.30 | 18.49 | 18.23 | 17.63 | |||||||||||||||
|
Market price at period end
|
17.28 | 25.39 | 24.93 | 26.59 | 25.87 | |||||||||||||||
|
Dividends
|
0.22 | 0.22 | 0.22 | 0.22 | 0.20 | |||||||||||||||
|
|
||||||||||||||||||||
|
PERFORMANCE RATIOS (3)
|
||||||||||||||||||||
|
Return on assets
|
0.85 | % | 0.46 | % | 0.55 | % | 0.67 | % | 0.83 | % | ||||||||||
|
Core return on assets (1) (2)
|
0.86 | 0.96 | 0.80 | 0.70 | 0.83 | |||||||||||||||
|
Return on equity
|
7.64 | 4.21 | 5.04 | 6.33 | 7.83 | |||||||||||||||
|
Core return on equity (1) (2)
|
7.71 | 8.81 | 7.36 | 6.57 | 7.83 | |||||||||||||||
|
Core return on tangible equity (1) (2)
|
11.54 | 12.66 | 10.31 | 9.30 | 11.19 | |||||||||||||||
|
Net interest margin, fully taxable equivalent (FTE) (2) (4)
|
3.06 | 2.95 | 2.75 | 2.65 | 2.77 | |||||||||||||||
|
Net interest margin (FTE), excluding purchased loan accretion (2) (4)
|
2.99 | 2.88 | 2.65 | 2.56 | 2.67 | |||||||||||||||
|
Efficiency ratio (2)
|
64.82 | 62.56 | 65.02 | 68.48 | 63.94 | |||||||||||||||
|
|
||||||||||||||||||||
|
ORGANIC GROWTH (Year-to-date, annualized) (2) (6)
|
||||||||||||||||||||
|
Total commercial loans
|
6.4 | % | 6.0 | % | 10.5 | % | 10.1 | % | (3.3 | )% | ||||||||||
|
Total loans
|
(0.9 | ) | 2.0 | 4.7 | 7.1 | 5.9 | ||||||||||||||
|
Total deposits
|
(6.7 | ) | (1.8 | ) | 0.6 | (0.1 | ) | (2.8 | ) | |||||||||||
|
|
||||||||||||||||||||
|
FINANCIAL DATA (In millions)
|
||||||||||||||||||||
|
Total assets
|
$ | 3,677 | $ | 3,669 | $ | 3,612 | $ | 3,688 | $ | 3,629 | ||||||||||
|
Total earning assets (5)
|
3,269 | 3,336 | 3,270 | 3,355 | 3,312 | |||||||||||||||
|
Total investments
|
646 | 684 | 703 | 784 | 782 | |||||||||||||||
|
Total loans
|
2,635 | 2,641 | 2,577 | 2,578 | 2,527 | |||||||||||||||
|
Allowance for loan losses
|
15 | 15 | 15 | 15 | 14 | |||||||||||||||
|
Total goodwill and intangible assets
|
128 | 127 | 107 | 107 | 107 | |||||||||||||||
|
Total deposits
|
2,651 | 2,696 | 2,494 | 2,481 | 2,466 | |||||||||||||||
|
Total shareholders' equity
|
404 | 396 | 394 | 391 | 381 | |||||||||||||||
|
Net income
|
8 | 4 | 5 | 6 | 7 | |||||||||||||||
|
Core earnings (1) (2)
|
8 | 9 | 7 | 6 | 7 | |||||||||||||||
|
|
||||||||||||||||||||
|
ASSET QUALITY AND CONDITION RATIOS
|
||||||||||||||||||||
|
Net charge-offs (current quarter annualized)/average loans
|
0.18 | % | 0.08 | % | 0.02 | % | - | % | 0.03 | % | ||||||||||
|
Allowance for loan losses/total loans
|
0.58 | 0.58 | 0.60 | 0.57 | 0.55 | |||||||||||||||
|
Loans/deposits
|
99 | 98 | 103 | 104 | 102 | |||||||||||||||
|
Shareholders' equity to total assets
|
10.98 | 10.80 | 10.92 | 10.59 | 10.50 | |||||||||||||||
|
Tangible shareholders' equity to tangible assets
|
7.77 | 7.60 | 8.20 | 7.92 | 7.77 | |||||||||||||||
- Core measurements are non-GAAP financial measures adjusted to exclude net non-operating charges primarily related to acquisitions, restructurings, system conversions, loss on debt extinguishment and gain or loss on sale of securities, other real estate owned and premises and equipment. Refer to the Reconciliation of Non-GAAP Financial Measures in table J for additional information.
- Non-GAAP financial measure.
- All performance ratios are based on average balance sheet amounts, where applicable.
- Fully taxable equivalent considers the impact of tax-advantaged investment securities and loans.
- Earning assets includes non-accruing loans and securities are valued at amortized cost.
- Assets acquired from eight branches purchased from People's United Bank, National Association as of October 25, 2019, were excluded from calculation.
BAR HARBOR BANKSHARES
CONSOLIDATED BALANCE SHEETS - UNAUDITED
|
|
Mar 31, | Dec 31, | Sep 30, | Jun 30, | Mar 31, | |||||||||||||||
|
(in thousands)
|
2020 | 2019 | 2019 | 2019 | 2019 | |||||||||||||||
|
Assets
|
||||||||||||||||||||
|
Cash and due from banks
|
$ | 68,481 | $ | 37,261 | $ | 50,032 | $ | 42,657 | $ | 37,504 | ||||||||||
|
Interest-bearing deposits with the Federal Reserve Bank
|
17,174 | 19,649 | 21,561 | 17,203 | 16,599 | |||||||||||||||
|
Total cash and cash equivalents
|
85,655 | 56,910 | 71,593 | 59,860 | 54,103 | |||||||||||||||
|
|
||||||||||||||||||||
|
Securities available for sale, at fair value
|
626,341 | 663,230 | 675,675 | 748,560 | 747,235 | |||||||||||||||
|
Federal Home Loan Bank stock
|
19,897 | 20,679 | 27,469 | 35,220 | 35,107 | |||||||||||||||
|
Total securities
|
646,238 | 683,909 | 703,144 | 783,780 | 782,342 | |||||||||||||||
|
|
||||||||||||||||||||
|
Commercial real estate
|
948,178 | 930,661 | 923,773 | 881,479 | 821,567 | |||||||||||||||
|
Commercial and industrial
|
426,357 | 423,291 | 402,706 | 416,725 | 409,937 | |||||||||||||||
|
Residential real estate
|
1,132,328 | 1,151,857 | 1,143,452 | 1,167,759 | 1,184,053 | |||||||||||||||
|
Consumer
|
128,120 | 135,283 | 107,375 | 112,275 | 111,402 | |||||||||||||||
|
Total loans
|
2,634,983 | 2,641,092 | 2,577,306 | 2,578,238 | 2,526,959 | |||||||||||||||
|
Less: Allowance for loan losses
|
(15,297 | ) | (15,353 | ) | (15,353 | ) | (14,572 | ) | (13,997 | ) | ||||||||||
|
Net loans
|
2,619,686 | 2,625,739 | 2,561,953 | 2,563,666 | 2,512,962 | |||||||||||||||
|
|
||||||||||||||||||||
|
Premises and equipment, net
|
49,978 | 51,205 | 47,644 | 50,230 | 49,661 | |||||||||||||||
|
Other real estate owned
|
2,205 | 2,236 | 2,455 | 2,351 | 2,351 | |||||||||||||||
|
Goodwill
|
119,477 | 118,649 | 100,085 | 100,085 | 100,085 | |||||||||||||||
|
Other intangible assets
|
8,398 | 8,641 | 6,879 | 7,072 | 7,266 | |||||||||||||||
|
Cash surrender value of bank-owned life insurance
|
76,400 | 75,863 | 75,368 | 74,871 | 74,352 | |||||||||||||||
|
Deferred tax asset, net
|
3,166 | 3,865 | 4,988 | 5,649 | 7,632 | |||||||||||||||
|
Other assets
|
66,139 | 42,111 | 38,365 | 40,071 | 38,441 | |||||||||||||||
|
Total assets
|
$ | 3,677,342 | $ | 3,669,128 | $ | 3,612,474 | $ | 3,687,635 | $ | 3,629,195 | ||||||||||
|
|
||||||||||||||||||||
|
Liabilities and shareholders' equity
|
||||||||||||||||||||
|
Demand and other non-interest bearing deposits
|
$ | 400,410 | $ | 414,534 | $ | 380,707 | $ | 354,125 | $ | 342,030 | ||||||||||
|
NOW deposits
|
578,320 | 575,809 | 490,315 | 472,576 | 470,277 | |||||||||||||||
|
Savings deposits
|
423,345 | 388,683 | 360,570 | 352,657 | 346,813 | |||||||||||||||
|
Money market deposits
|
404,385 | 384,090 | 359,328 | 305,506 | 349,833 | |||||||||||||||
|
Time deposits
|
844,097 | 932,635 | 902,665 | 996,512 | 956,818 | |||||||||||||||
|
Total deposits
|
2,650,557 | 2,695,751 | 2,493,585 | 2,481,376 | 2,465,771 | |||||||||||||||
|
|
||||||||||||||||||||
|
Senior borrowings
|
497,580 | 471,396 | 641,819 | 733,084 | 703,283 | |||||||||||||||
|
Subordinated borrowings
|
59,849 | 59,920 | 42,928 | 42,943 | 42,958 | |||||||||||||||
|
Total borrowings
|
557,429 | 531,316 | 684,747 | 776,027 | 746,241 | |||||||||||||||
|
|
||||||||||||||||||||
|
Other liabilities
|
65,601 | 45,654 | 39,683 | 39,670 | 36,160 | |||||||||||||||
|
Total liabilities
|
3,273,587 | 3,272,721 | 3,218,015 | 3,297,073 | 3,248,172 | |||||||||||||||
|
|
||||||||||||||||||||
|
Total common shareholders' equity
|
403,755 | 396,407 | 394,459 | 390,562 | 381,023 | |||||||||||||||
|
Total liabilities and shareholders' equity
|
$ | 3,677,342 | $ | 3,669,128 | $ | 3,612,474 | $ | 3,687,635 | $ | 3,629,195 | ||||||||||
|
|
||||||||||||||||||||
|
Net shares outstanding
|
15,587 | 15,558 | 15,549 | 15,544 | 15,524 | |||||||||||||||
BAR HARBOR BANKSHARES
CONSOLIDATED LOAN & DEPOSIT ANALYSIS - UNAUDITED
LOAN ANALYSIS
|
|
Annualized | |||||||||||||||||||||||
|
|
Growth % | |||||||||||||||||||||||
|
|
Mar 31, | Dec 31, | Sep 30, | Jun 30, | Mar 31, | Quarter | ||||||||||||||||||
|
(in thousands)
|
2020 | 2019 | 2019 | 2019 | 2019 | End | ||||||||||||||||||
|
Commercial real estate
|
$ | 948,178 | $ | 930,661 | $ | 923,773 | $ | 881,479 | $ | 821,567 | 7.5 | % | ||||||||||||
|
Commercial and industrial
|
321,605 | 318,988 | 301,590 | 312,029 | 305,185 | 3.3 | ||||||||||||||||||
|
Total commercial loans
|
1,269,783 | 1,249,649 | 1,225,363 | 1,193,508 | 1,126,752 | 6.4 | ||||||||||||||||||
|
Residential real estate
|
1,132,328 | 1,151,857 | 1,143,452 | 1,167,759 | 1,184,053 | (6.8 | ) | |||||||||||||||||
|
Consumer
|
128,120 | 135,283 | 107,375 | 112,275 | 111,402 | (21.2 | ) | |||||||||||||||||
|
Tax exempt and other
|
104,752 | 104,303 | 101,116 | 104,696 | 104,752 | 1.7 | ||||||||||||||||||
|
Total loans
|
$ | 2,634,983 | $ | 2,641,092 | $ | 2,577,306 | $ | 2,578,238 | $ | 2,526,959 | (0.9 | )% | ||||||||||||
DEPOSIT ANALYSIS
|
|
Annualized | |||||||||||||||||||||||
|
|
Growth % | |||||||||||||||||||||||
|
|
Mar 31, | Dec 31, | Sep 30, | Jun 30, | Mar 31, | Quarter | ||||||||||||||||||
|
(in thousands)
|
2020 | 2019 | 2019 | 2019 | 2019 | End | ||||||||||||||||||
|
Demand
|
$ | 400,410 | $ | 414,534 | $ | 380,707 | $ | 354,125 | $ | 342,030 | (13.6 | )% | ||||||||||||
|
NOW
|
578,320 | 575,809 | 490,315 | 472,576 | 470,277 | 1.7 | ||||||||||||||||||
|
Savings
|
423,345 | 388,683 | 360,570 | 352,657 | 346,813 | 35.7 | ||||||||||||||||||
|
Money market
|
404,385 | 384,090 | 359,328 | 305,506 | 349,833 | 21.1 | ||||||||||||||||||
|
Total non-maturity deposits
|
1,806,460 | 1,763,116 | 1,590,920 | 1,484,864 | 1,508,953 | 9.8 | ||||||||||||||||||
|
Total time deposits
|
844,097 | 932,635 | 902,665 | 996,512 | 956,818 | (38.0 | ) | |||||||||||||||||
|
Total deposits
|
$ | 2,650,557 | $ | 2,695,751 | $ | 2,493,585 | $ | 2,481,376 | $ | 2,465,771 | (6.7 | )% | ||||||||||||
BAR HARBOR BANKSHARES
CONSOLIDATED STATEMENTS OF INCOME - UNAUDITED
|
|
Three Months Ended | |||||||
|
|
March 31, | |||||||
|
(in thousands, except per share data)
|
2020 | 2019 | ||||||
|
Interest and dividend income
|
||||||||
|
Loans
|
$ | 27,987 | $ | 26,864 | ||||
|
Securities and other
|
5,507 | 6,363 | ||||||
|
Total interest and dividend income
|
33,494 | 33,227 | ||||||
|
Interest expense
|
||||||||
|
Deposits
|
6,020 | 6,307 | ||||||
|
Borrowings
|
2,911 | 5,155 | ||||||
|
Total interest expense
|
8,931 | 11,462 | ||||||
|
Net interest income
|
24,563 | 21,765 | ||||||
|
Provision for loan losses
|
1,111 | 324 | ||||||
|
Net interest income after provision for loan losses
|
23,452 | 21,441 | ||||||
|
Non-interest income
|
||||||||
|
Trust and investment management fee income
|
3,369 | 2,757 | ||||||
|
Customer service fees
|
3,112 | 2,165 | ||||||
|
Gain (loss) on sales of securities, net
|
135 | - | ||||||
|
Bank-owned life insurance income
|
537 | 542 | ||||||
|
Customer derivative income
|
588 | 29 | ||||||
|
Other income
|
680 | 674 | ||||||
|
Total non-interest income
|
8,421 | 6,167 | ||||||
|
Non-interest expense
|
||||||||
|
Salaries and employee benefits
|
11,884 | 10,519 | ||||||
|
Occupancy and equipment
|
4,420 | 3,386 | ||||||
|
Loss on sales of premises and equipment, net
|
92 | - | ||||||
|
Outside services
|
534 | 411 | ||||||
|
Professional services
|
672 | 544 | ||||||
|
Communication
|
289 | 235 | ||||||
|
Marketing
|
388 | 295 | ||||||
|
Amortization of intangible assets
|
256 | 207 | ||||||
|
Acquisition, conversion and other expenses
|
103 | - | ||||||
|
Other expenses
|
3,721 | 3,027 | ||||||
|
Total non-interest expense
|
22,359 | 18,624 | ||||||
|
Income before income taxes
|
9,514 | 8,984 | ||||||
|
Income tax expense
|
1,793 | 1,703 | ||||||
|
Net income
|
$ | 7,721 | $ | 7,281 | ||||
|
|
||||||||
|
Earnings per share:
|
||||||||
|
Basic
|
$ | 0.50 | $ | 0.47 | ||||
|
Diluted
|
0.50 | 0.47 | ||||||
|
|
||||||||
|
Weighted average shares outstanding:
|
||||||||
|
Basic
|
15,558 | 15,523 | ||||||
|
Diluted
|
15,593 | 15,587 | ||||||
BAR HARBOR BANKSHARES
CONSOLIDATED STATEMENTS OF INCOME (5 Quarter Trend) - UNAUDITED
|
|
Mar 31, | Dec 31, | Sep 30, | Jun 30, | Mar 31, | |||||||||||||||
|
(in thousands, except per share data)
|
2020 | 2019 | 2019 | 2019 | 2019 | |||||||||||||||
|
Interest and dividend income
|
||||||||||||||||||||
|
Loans
|
$ | 27,987 | $ | 28,361 | $ | 28,157 | $ | 27,660 | $ | 26,864 | ||||||||||
|
Securities and other
|
5,507 | 5,756 | 6,105 | 6,125 | 6,363 | |||||||||||||||
|
Total interest and dividend income
|
33,494 | 34,117 | 34,262 | 33,785 | 33,227 | |||||||||||||||
|
Interest expense
|
||||||||||||||||||||
|
Deposits
|
6,020 | 6,698 | 7,143 | 6,886 | 6,307 | |||||||||||||||
|
Borrowings
|
2,911 | 3,315 | 4,674 | 5,403 | 5,155 | |||||||||||||||
|
Total interest expense
|
8,931 | 10,013 | 11,817 | 12,289 | 11,462 | |||||||||||||||
|
Net interest income
|
24,563 | 24,104 | 22,445 | 21,496 | 21,765 | |||||||||||||||
|
Provision for loan losses
|
1,111 | 538 | 893 | 562 | 324 | |||||||||||||||
|
Net interest income after provision for loan losses
|
23,452 | 23,566 | 21,552 | 20,934 | 21,441 | |||||||||||||||
|
Non-interest income
|
||||||||||||||||||||
|
Trust and investment management fee income
|
3,369 | 3,227 | 3,013 | 3,066 | 2,757 | |||||||||||||||
|
Customer service fees
|
3,112 | 2,791 | 2,553 | 2,618 | 2,165 | |||||||||||||||
|
Gain on sales of securities, net
|
135 | 80 | 157 | - | - | |||||||||||||||
|
Bank-owned life insurance income
|
537 | 495 | 497 | 519 | 542 | |||||||||||||||
|
Customer derivative income
|
588 | 475 | 828 | 696 | 29 | |||||||||||||||
|
Other income
|
680 | 738 | 595 | 554 | 674 | |||||||||||||||
|
Total non-interest income
|
8,421 | 7,806 | 7,643 | 7,453 | 6,167 | |||||||||||||||
|
Non-interest expense
|
||||||||||||||||||||
|
Salaries and employee benefits
|
11,884 | 11,432 | 11,364 | 11,685 | 10,519 | |||||||||||||||
|
Occupancy and equipment
|
4,420 | 4,113 | 3,415 | 3,300 | 3,386 | |||||||||||||||
|
Loss (gain) on sales of premises and equipment, net
|
92 | (3 | ) | - | 21 | - | ||||||||||||||
|
Outside services
|
534 | 540 | 424 | 443 | 411 | |||||||||||||||
|
Professional services
|
672 | 370 | 707 | 570 | 544 | |||||||||||||||
|
Communication
|
289 | 114 | 189 | 283 | 235 | |||||||||||||||
|
Marketing
|
388 | 453 | 613 | 511 | 295 | |||||||||||||||
|
Amortization of intangible assets
|
256 | 240 | 207 | 207 | 207 | |||||||||||||||
|
Loss on debt extinguishment
|
- | 1,096 | - | - | - | |||||||||||||||
|
Acquisition, conversion and other expenses
|
103 | 4,998 | 3,039 | 280 | - | |||||||||||||||
|
Other expenses
|
3,721 | 3,450 | 3,442 | 3,606 | 3,027 | |||||||||||||||
|
Total non-interest expense
|
22,359 | 26,803 | 23,400 | 20,906 | 18,624 | |||||||||||||||
|
Income before income taxes
|
9,514 | 4,569 | 5,795 | 7,481 | 8,984 | |||||||||||||||
|
Income tax expense
|
1,793 | 362 | 780 | 1,364 | 1,703 | |||||||||||||||
|
Net income
|
$ | 7,721 | $ | 4,207 | $ | 5,015 | $ | 6,117 | $ | 7,281 | ||||||||||
|
|
||||||||||||||||||||
|
Earnings per share:
|
||||||||||||||||||||
|
Basic
|
$ | 0.50 | $ | 0.27 | $ | 0.32 | $ | 0.39 | $ | 0.47 | ||||||||||
|
Diluted
|
0.50 | 0.27 | 0.32 | 0.39 | 0.47 | |||||||||||||||
|
|
||||||||||||||||||||
|
Weighted average shares outstanding:
|
||||||||||||||||||||
|
Basic
|
15,558 | 15,554 | 15,547 | 15,538 | 15,523 | |||||||||||||||
|
Diluted
|
15,593 | 15,602 | 15,581 | 15,586 | 15,587 | |||||||||||||||
BAR HARBOR BANKSHARES
AVERAGE YIELDS AND COSTS (Fully Taxable Equivalent - Annualized) - UNAUDITED
|
|
Quarters Ended | |||||||||||||||||||
|
|
Mar 31, | Dec 31, | Sep 30, | Jun 30, | Mar 31, | |||||||||||||||
|
|
2020 | 2019 | 2019 | 2019 | 2019 | |||||||||||||||
|
Earning assets
|
||||||||||||||||||||
|
Commercial real estate
|
4.46 | % | 4.69 | % | 4.74 | % | 4.74 | % | 4.78 | % | ||||||||||
|
Commercial and industrial
|
4.89 | 4.58 | 4.78 | 4.75 | 4.79 | |||||||||||||||
|
Residential
|
3.84 | 3.89 | 3.88 | 3.93 | 3.94 | |||||||||||||||
|
Consumer
|
5.20 | 4.84 | 5.13 | 5.21 | 5.25 | |||||||||||||||
|
Total loans
|
4.30 | 4.33 | 4.38 | 4.39 | 4.42 | |||||||||||||||
|
Securities and other
|
3.53 | 3.49 | 3.44 | 3.29 | 3.47 | |||||||||||||||
|
Total earning assets
|
4.14 | % | 4.15 | % | 4.17 | % | 4.13 | % | 4.19 | % | ||||||||||
|
|
||||||||||||||||||||
|
Funding liabilities
|
||||||||||||||||||||
|
NOW
|
0.40 | % | 0.44 | % | 0.51 | % | 0.49 | % | 0.51 | % | ||||||||||
|
Savings
|
0.25 | 0.20 | 0.21 | 0.21 | 0.19 | |||||||||||||||
|
Money market
|
1.01 | 1.17 | 1.37 | 1.44 | 1.38 | |||||||||||||||
|
Time deposits
|
1.92 | 2.06 | 2.16 | 2.11 | 2.00 | |||||||||||||||
|
Total interest-bearing deposits
|
1.08 | 1.19 | 1.33 | 1.32 | 1.25 | |||||||||||||||
|
Borrowings
|
2.10 | 2.30 | 2.62 | 2.74 | 2.74 | |||||||||||||||
|
Total interest-bearing liabilities
|
1.28 | % | 1.42 | % | 1.65 | % | 1.71 | % | 1.66 | % | ||||||||||
|
|
||||||||||||||||||||
|
Net interest spread
|
2.86 | 2.73 | 2.52 | 2.42 | 2.53 | |||||||||||||||
|
Net interest margin
|
3.06 | 2.95 | 2.75 | 2.65 | 2.77 | |||||||||||||||
BAR HARBOR BANKSHARES
AVERAGE BALANCES - UNAUDITED
|
|
Quarters Ended | |||||||||||||||||||
|
|
Mar 31, | Dec 31, | Sep 30, | Jun 30, | Mar 31, | |||||||||||||||
|
(in thousands)
|
2020 | 2019 | 2019 | 2019 | 2019 | |||||||||||||||
|
Assets
|
||||||||||||||||||||
|
Commercial real estate
|
$ | 945,851 | $ | 928,445 | $ | 900,568 | $ | 846,921 | $ | 825,596 | ||||||||||
|
Commercial and industrial
|
423,393 | 412,595 | 410,453 | 416,000 | 405,107 | |||||||||||||||
|
Residential real estate
|
1,141,908 | 1,156,215 | 1,154,552 | 1,176,583 | 1,143,862 | |||||||||||||||
|
Consumer
|
130,471 | 127,425 | 109,562 | 111,641 | 113,060 | |||||||||||||||
|
Total loans (1)
|
2,641,623 | 2,624,680 | 2,575,135 | 2,551,145 | 2,487,625 | |||||||||||||||
|
Securities and other (2)
|
661,848 | 683,939 | 732,925 | 779,072 | 777,458 | |||||||||||||||
|
Total earning assets
|
3,303,471 | 3,308,619 | 3,308,060 | 3,330,217 | 3,265,083 | |||||||||||||||
|
Cash and due from banks
|
57,751 | 67,642 | 62,999 | 52,728 | 50,298 | |||||||||||||||
|
Allowance for loan losses
|
(15,242 | ) | (15,657 | ) | (14,965 | ) | (14,459 | ) | (14,119 | ) | ||||||||||
|
Goodwill and other intangible assets
|
128,014 | 114,537 | 107,058 | 107,252 | 107,446 | |||||||||||||||
|
Other assets
|
187,765 | 179,512 | 178,804 | 170,340 | 152,332 | |||||||||||||||
|
Total assets
|
$ | 3,661,759 | $ | 3,654,653 | $ | 3,641,956 | $ | 3,646,078 | $ | 3,561,040 | ||||||||||
|
|
||||||||||||||||||||
|
Liabilities and shareholders' equity
|
||||||||||||||||||||
|
NOW
|
$ | 570,127 | $ | 551,335 | $ | 487,506 | $ | 459,572 | $ | 468,392 | ||||||||||
|
Savings
|
410,931 | 378,997 | 359,242 | 352,733 | 346,707 | |||||||||||||||
|
Money market
|
373,650 | 379,361 | 338,013 | 338,095 | 335,882 | |||||||||||||||
|
Time deposits
|
892,654 | 918,528 | 947,949 | 935,616 | 894,160 | |||||||||||||||
|
Total interest bearing deposits
|
2,247,362 | 2,228,221 | 2,132,710 | 2,086,016 | 2,045,141 | |||||||||||||||
|
Borrowings
|
556,824 | 571,936 | 708,222 | 789,953 | 761,885 | |||||||||||||||
|
Total interest-bearing liabilities
|
2,804,186 | 2,800,157 | 2,840,932 | 2,875,969 | 2,807,026 | |||||||||||||||
|
Non-interest-bearing demand deposits
|
406,951 | 418,324 | 368,100 | 349,322 | 351,362 | |||||||||||||||
|
Other liabilities
|
44,343 | 40,136 | 37,975 | 33,107 | 25,520 | |||||||||||||||
|
Total liabilities
|
3,255,480 | 3,258,617 | 3,247,007 | 3,258,398 | 3,183,908 | |||||||||||||||
|
|
||||||||||||||||||||
|
Total shareholders' equity
|
406,279 | 396,036 | 394,949 | 387,680 | 377,132 | |||||||||||||||
|
|
||||||||||||||||||||
|
Total liabilities and shareholders' equity
|
$ | 3,661,759 | $ | 3,654,653 | $ | 3,641,956 | $ | 3,646,078 | $ | 3,561,040 | ||||||||||
- Total loans include non-accruing loans.
- Average balances for securities available-for-sale are based on amortized cost.
BAR HARBOR BANKSHARES
ASSET QUALITY ANALYSIS - UNAUDITED
|
|
At or for the Quarters Ended | |||||||||||||||||||
|
|
Mar 31, | Dec 31, | Sep 30, | Jun 30, | Mar 31, | |||||||||||||||
|
(in thousands)
|
2020 | 2019 | 2019 | 2019 | 2019 | |||||||||||||||
|
NON-PERFORMING ASSETS
|
||||||||||||||||||||
|
Non-accruing loans:
|
||||||||||||||||||||
|
Commercial real estate
|
$ | 2,227 | $ | 3,489 | $ | 8,519 | $ | 7,048 | $ | 7,516 | ||||||||||
|
Commercial installment
|
1,996 | 1,836 | 2,077 | 2,081 | 2,192 | |||||||||||||||
|
Residential real estate
|
5,089 | 5,335 | 5,340 | 5,965 | 6,326 | |||||||||||||||
|
Consumer installment
|
744 | 890 | 743 | 861 | 565 | |||||||||||||||
|
Total non-accruing loans
|
10,056 | 11,550 | 16,679 | 15,955 | 16,599 | |||||||||||||||
|
Other real estate owned
|
2,205 | 2,236 | 2,455 | 2,351 | 2,351 | |||||||||||||||
|
Total non-performing assets
|
$ | 12,261 | $ | 13,786 | $ | 19,134 | $ | 18,306 | $ | 18,950 | ||||||||||
|
|
||||||||||||||||||||
|
Total non-accruing loans/total loans
|
0.38 | % | 0.44 | % | 0.65 | % | 0.62 | % | 0.66 | % | ||||||||||
|
Total non-performing assets/total assets
|
0.33 | 0.38 | 0.53 | 0.50 | 0.52 | |||||||||||||||
|
|
||||||||||||||||||||
|
PROVISION AND ALLOWANCE FOR LOAN LOSSES
|
||||||||||||||||||||
|
Balance at beginning of period
|
$ | 15,353 | $ | 15,353 | $ | 14,572 | $ | 13,997 | $ | 13,866 | ||||||||||
|
Charged-off loans
|
(1,211 | ) | (603 | ) | (215 | ) | (104 | ) | (231 | ) | ||||||||||
|
Recoveries on charged-off loans
|
44 | 65 | 103 | 117 | 38 | |||||||||||||||
|
Net loans charged-off
|
(1,167 | ) | (538 | ) | (112 | ) | 13 | (193 | ) | |||||||||||
|
Provision for loan losses
|
1,111 | 538 | 893 | 562 | 324 | |||||||||||||||
|
Balance at end of period
|
$ | 15,297 | $ | 15,353 | $ | 15,353 | $ | 14,572 | $ | 13,997 | ||||||||||
|
|
||||||||||||||||||||
|
Allowance for loan losses/total loans
|
0.58 | % | 0.58 | % | 0.60 | % | 0.57 | % | 0.55 | % | ||||||||||
|
Allowance for loan losses/non-accruing loans
|
152 | 133 | 92 | 91 | 84 | |||||||||||||||
|
|
||||||||||||||||||||
|
NET LOAN CHARGE-OFFS
|
||||||||||||||||||||
|
Commercial real estate
|
$ | (846 | ) | $ | (92 | ) | $ | 1 | $ | 114 | $ | (41 | ) | |||||||
|
Commercial installment
|
(170 | ) | (331 | ) | 62 | (12 | ) | (15 | ) | |||||||||||
|
Residential real estate
|
(1 | ) | (16 | ) | (124 | ) | (65 | ) | (86 | ) | ||||||||||
|
Consumer installment
|
(150 | ) | (99 | ) | (51 | ) | (24 | ) | (51 | ) | ||||||||||
|
Total, net
|
$ | (1,167 | ) | $ | (538 | ) | $ | (112 | ) | $ | 13 | $ | (193 | ) | ||||||
|
|
||||||||||||||||||||
|
Net charge-offs (QTD annualized)/average loans
|
0.18 | % | 0.08 | % | 0.02 | % | 0.03 | % | 0.03 | % | ||||||||||
|
Net charge-offs (YTD annualized)/average loans
|
0.18 | 0.03 | 0.02 | 0.01 | 0.03 | |||||||||||||||
|
|
||||||||||||||||||||
|
DELINQUENT AND NON-ACCRUING LOANS/ TOTAL LOANS
|
||||||||||||||||||||
|
30-89 Days delinquent
|
0.84 | % | 0.74 | % | 0.18 | % | 0.29 | % | 0.21 | % | ||||||||||
|
90+ Days delinquent and still accruing
|
0.08 | 0.01 | 0.03 | - | - | |||||||||||||||
|
Total accruing delinquent loans
|
0.92 | 0.75 | 0.21 | 0.29 | 0.21 | |||||||||||||||
|
Non-accruing loans
|
0.38 | 0.44 | 0.65 | 0.62 | 0.66 | |||||||||||||||
|
Total delinquent and non-accruing loans
|
1.30 | % | 1.19 | % | 0.86 | % | 0.91 | % | 0.87 | % | ||||||||||
BAR HARBOR BANKSHARES
RECONCILIATION OF NON-GAAP FINANCIAL MEASURES AND SUPPLEMENTARY DATA - UNAUDITED
|
|
|
At or for the Quarters Ended | |||||||||||||||||||
|
|
|
Mar 31, | Dec 31, | Sep 30, | Jun 30, | Mar 31, | |||||||||||||||
|
(in thousands)
|
|
2020 | 2019 | 2019 | 2019 | 2019 | |||||||||||||||
|
Net income
|
|
$ | 7,721 | $ | 4,207 | $ | 5,015 | $ | 6,117 | $ | 7,281 | ||||||||||
|
Plus (less):
|
|
||||||||||||||||||||
|
Gain on sale of securities, net
|
|
(135 | ) | (80 | ) | (157 | ) | - | - | ||||||||||||
|
Loss (gain) on sale of premises and equipment, net
|
|
92 | (3 | ) | - | 21 | - | ||||||||||||||
|
Loss on other real estate owned
|
|
31 | 20 | 146 | - | - | |||||||||||||||
|
Loss on debt extinguishment
|
|
- | 1,096 | - | - | - | |||||||||||||||
|
Acquisition, restructuring and other expenses
|
|
103 | 4,998 | 3,039 | 280 | - | |||||||||||||||
|
Income tax expense (1)
|
|
(22 | ) | (1,440 | ) | (720 | ) | (72 | ) | - | |||||||||||
|
Total core earnings (2)
|
(A)
|
$ | 7,790 | $ | 8,798 | $ | 7,323 | $ | 6,346 | $ | 7,281 | ||||||||||
|
|
|
||||||||||||||||||||
|
Net interest income
|
(B)
|
$ | 24,563 | $ | 24,104 | $ | 22,445 | $ | 21,496 | $ | 21,765 | ||||||||||
|
Plus: Non-interest income
|
|
8,421 | 7,806 | 7,643 | 7,453 | 6,167 | |||||||||||||||
|
Total Revenue
|
|
32,984 | 31,910 | 30,088 | 28,949 | 27,932 | |||||||||||||||
|
Adj: Gain on sale of securities, net
|
|
(135 | ) | (80 | ) | (157 | ) | - | - | ||||||||||||
|
Total core revenue (2)
|
(C)
|
$ | 32,849 | $ | 31,830 | $ | 29,931 | $ | 28,949 | $ | 27,932 | ||||||||||
|
|
|
||||||||||||||||||||
|
Total non-interest expense
|
|
22,359 | 26,803 | 23,400 | 20,906 | 18,624 | |||||||||||||||
|
Less: (Loss) gain on sale of premises and equipment, net
|
|
(92 | ) | 3 | - | (21 | ) | - | |||||||||||||
|
Less: Loss on other real estate owned
|
|
(31 | ) | (20 | ) | (146 | ) | - | - | ||||||||||||
|
Less: Loss on debt extinguishment
|
|
- | (1,096 | ) | - | - | - | ||||||||||||||
|
Less: Acquisition, conversion and other expenses
|
|
(103 | ) | (4,998 | ) | (3,039 | ) | (280 | ) | - | |||||||||||
|
Core non-interest expense (2)
|
(D)
|
$ | 22,133 | $ | 20,692 | $ | 20,215 | $ | 20,605 | $ | 18,624 | ||||||||||
|
|
|
||||||||||||||||||||
|
(in millions)
|
|
||||||||||||||||||||
|
Total average earning assets
|
(E)
|
$ | 3,306 | $ | 3,309 | $ | 3,308 | $ | 3,330 | $ | 3,265 | ||||||||||
|
Total average assets
|
(F)
|
3,662 | 3,655 | 3,642 | 3,646 | 3,561 | |||||||||||||||
|
Total average shareholders' equity
|
(G)
|
406 | 396 | 395 | 388 | 377 | |||||||||||||||
|
Total average tangible shareholders' equity (2) (3)
|
(H)
|
278 | 281 | 288 | 280 | 270 | |||||||||||||||
|
Total tangible shareholders' equity, period-end (2) (3)
|
(I)
|
276 | 269 | 287 | 283 | 274 | |||||||||||||||
|
Total tangible assets, period-end (2) (3)
|
(J)
|
3,549 | 3,542 | 3,506 | 3,580 | 3,522 | |||||||||||||||
|
|
|
||||||||||||||||||||
|
(in thousands)
|
|
||||||||||||||||||||
|
Total common shares outstanding, period-end
|
(K)
|
15,587 | 15,558 | 15,549 | 15,544 | 15,524 | |||||||||||||||
|
Average diluted shares outstanding
|
(L)
|
15,593 | 15,602 | 15,581 | 15,586 | 15,587 | |||||||||||||||
|
|
|
||||||||||||||||||||
|
Core earnings per share, diluted (2)
|
(A/L)
|
$ | 0.50 | $ | 0.56 | $ | 0.47 | $ | 0.41 | $ | 0.47 | ||||||||||
|
Tangible book value per share, period-end (2)
|
(I/K)
|
17.70 | 17.30 | 18.49 | 18.23 | 17.63 | |||||||||||||||
|
Securities adjustment, net of tax (1) (4)
|
(M)
|
9,560 | 5,549 | 8,002 | 5,550 | (1,842 | ) | ||||||||||||||
|
Tangible book value per share, excluding securities adjustment (2)
|
(I+M)/K
|
17.09 | 16.94 | 17.98 | 17.88 | 17.75 | |||||||||||||||
|
Total tangible shareholders' equity/total tangible assets (2)
|
(I/J)
|
7.77 | 7.60 | 8.20 | 7.92 | 7.77 | |||||||||||||||
BAR HARBOR BANKSHARES
RECONCILIATION OF NON-GAAP FINANCIAL MEASURES AND SUPPLEMENTARY DATA - UNAUDITED
|
|
At or for the Quarters Ended | |||||||||||||||||||||||
|
|
Mar 31, | Dec 31, | Sep 30, | Jun 30, | Mar 31, | |||||||||||||||||||
|
(in thousands)
|
2020 | 2019 | 2019 | 2019 | 2019 | |||||||||||||||||||
|
Performance ratios (5)
|
||||||||||||||||||||||||
|
GAAP return on assets
|
0.85 | % | 0.46 | % | 0.55 | % | 0.67 | % | 0.83 | % | ||||||||||||||
|
Core return on assets (2)
|
(A/F) | 0.86 | 0.96 | 0.80 | 0.70 | 0.83 | ||||||||||||||||||
|
GAAP return on equity
|
7.64 | 4.21 | 5.04 | 6.33 | 7.83 | |||||||||||||||||||
|
Core return on equity (2)
|
(A/G) | 7.71 | 8.81 | 7.36 | 6.57 | 7.83 | ||||||||||||||||||
|
Core return on tangible equity (2) (6)
|
(A+Q)/H | 11.54 | 12.66 | 10.31 | 9.30 | 11.19 | ||||||||||||||||||
|
Efficiency ratio (2) (7)
|
(D-O-Q)/(C+N) | 64.82 | 62.56 | 65.02 | 68.48 | 63.94 | ||||||||||||||||||
|
Net interest margin
|
(B+P)/E | 3.06 | 2.95 | 2.75 | 2.65 | 2.77 | ||||||||||||||||||
|
|
||||||||||||||||||||||||
|
Supplementary data (in thousands)
|
||||||||||||||||||||||||
|
Taxable equivalent adjustment for efficiency ratio
|
(N) | $ | 719 | $ | 674 | $ | 658 | $ | 676 | $ | 684 | |||||||||||||
|
Franchise taxes included in non-interest expense
|
(O) | 119 | 119 | 119 | 111 | 120 | ||||||||||||||||||
|
Tax equivalent adjustment for net interest margin
|
(P) | 551 | 516 | 503 | 514 | 515 | ||||||||||||||||||
|
Intangible amortization
|
(Q) | 256 | 240 | 207 | 207 | 207 | ||||||||||||||||||
- Assumes a marginal tax rate of 23.87% for the first quarter of 2020 and the fourth quarter of 2019 and 23.78% in the first three quarters of 2019.
- Non-GAAP financial measure.
- Tangible shareholders' equity is computed by taking total shareholders' equity less the intangible assets at period-end. Tangible assets is computed by taking total assets less the intangible assets at period-end.
- Securities adjustment, net of tax represents the total unrealized loss on available-for-sale securities recorded on the Company's consolidated balance sheets within total common shareholders' equity.
- All performance ratios are based on average balance sheet amounts, where applicable.
- Adjusted return on tangible equity is computed by taking core earnings divided by shareholders' equity less the tax-effected amortization of intangible assets, assuming a marginal rate of 23.87% for the first quarter of 2020 and the fourth quarter of 2019, and 23.78% in the first three quarters of 2019.
- Efficiency ratio is computed by dividing core non-interest expense net of franchise taxes and intangible amortization divided by core revenue on a fully taxable equivalent basis.
SOURCE: Bar Harbor Bankshares