


Full Year Net Income Of $4,043,000
FORT WORTH, TX / ACCESSWIRE / January 29, 2020 / Trinity Bank N.A. (OTC PINK:TYBT) today announced operating results for the fourth quarter and the twelve months ending December 31, 2019.
Results of Operation
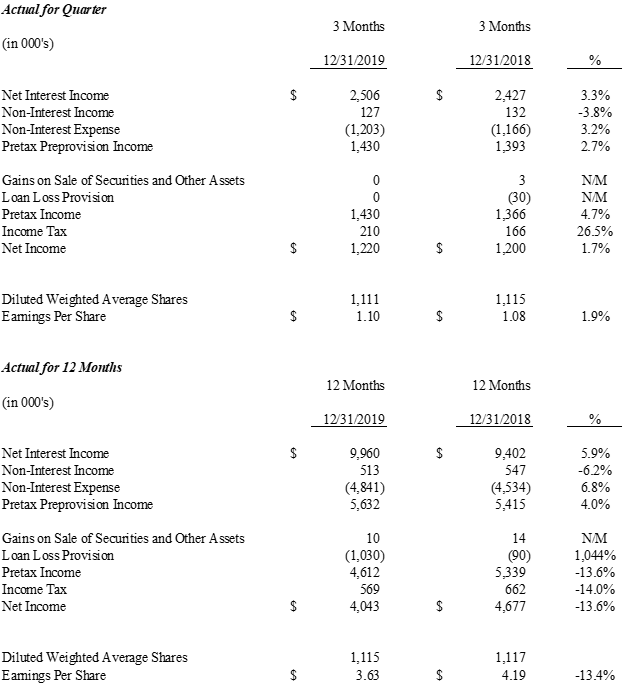
For the fourth quarter 2019, Trinity Bank, N.A. reported Net Income after Taxes of $1,220,000, an increase of 1.7% over fourth quarter 2018 earnings of $1,200,000. Earnings per diluted common share for the fourth quarter 2019 amounted to $1.10, an increase of 1.9% over fourth quarter 2018 results of $1.08 per diluted common share.
For 2019, Net Income after Taxes was $4,043,000, a decrease of (13.6%) over 2018 results of $4,677,000. Earnings per diluted common share for 2019 were $3.63, a decrease of (13.4%) over 2018 results of $4.19 per diluted common share.
President Jeffrey M. Harp stated, "2019 results were favorable and yielded the second best year of performance in our 16 year history. While 2019 was a good year, it came with a few challenges. In April 2019, we identified a large problem loan relationship. We conservatively made a loan loss provision on a worst case basis. It now appears we have a reasonable chance to recover a significant portion of the debt. Further, following 9 prime rate increases from 2015 through December 2018 (and projections for at least three more increases in 2019) the Federal Reserve abruptly reversed course and decreased the prime rate three times - July, September and October 2019, creating material net interest margin pressure."
Executive Vice President Matt R. Opitz commented, "We are pleased with overall deposit growth in 2019. There were three primary factors that contributed to this above average growth:
- The recovery from the unusually adverse weather conditions in late 2018 and early 2019 that affected our largest market segment- commercial construction.
- We maintained a focus on providing competitive rates to attract new deposit relationships and incentivize deposit growth within our existing customer base.
- Many of our customers had a great year in 2019 which generated strong positive cash flow."
|
|
|
In 000’s |
|
|
|
Month end 12/31/2019 |
Month end 12/31/2018 |
∆ |
|
Loans |
$ 167,589 |
$ 154,184 |
8.7 % |
|
Deposits |
$ 270,718 |
$ 223,647 |
21.0 % |
|
Liquid Assets |
$ 60,603 |
$ 13,127 |
361.7 % |
"We have mentioned this in the past but we now find ourselves in the longest economic expansionary period in history. While we cannot predict the future, we are encouraged by the fact that we operate in one of the best markets in the country and look forward to continued growth and success in 2020."
Page 2 - Trinity Bank fourth quarter 2019 earnings
Page 3 - Trinity Bank fourth quarter 2019 earnings
Trinity Bank, N.A. is a commercial bank that began operations May 28, 2003. For a full financial statement, visit Trinity Bank's website: www.trinitybk.com Regulatory reporting format is also available at www.fdic.gov.
For information contact:
Richard Burt
Executive Vice President
Trinity Bank
817-763-9966
This Press Release may contain certain forward-looking statements within the meaning of the Private Securities Litigation Reform Act of 1995 regarding future financial conditions, results of operations and the Bank's business operations. Such forward-looking statements involve risks, uncertainties and assumptions, including, but not limited to, monetary policy and general economic conditions in Texas and the greater Dallas-Fort Worth metropolitan area, the risks of changes in interest rates on the level and composition of deposits, loan demand and the values of loan collateral, securities and interest rate protection agreements, the actions of competitors and customers, the success of the Bank in implementing its strategic plan, the failure of the assumptions underlying the reserves for loan losses and the estimations of values of collateral and various financial assets and liabilities, that the costs of technological changes are more difficult or expensive than anticipated, the effects of regulatory restrictions imposed on banks generally, any changes in fiscal, monetary or regulatory policies and other uncertainties as discussed in the Bank's Registration Statement on Form SB‑1 filed with the Office of the Comptroller of the Currency. Should one or more of these risks or uncertainties materialize, or should these underlying assumptions prove incorrect, actual outcomes may vary materially from outcomes expected or anticipated by the Bank. A forward-looking statement may include a statement of the assumptions or bases underlying the forward‑looking statement. The Bank believes it has chosen these assumptions or bases in good faith and that they are reasonable. However, the Bank cautions you that assumptions or bases almost always vary from actual results, and the differences between assumptions or bases and actual results can be material. The Bank undertakes no obligation to publicly update or otherwise revise any forward‑looking statements, whether as a result of new information, future events or otherwise, unless the securities laws require the Bank to do so.
TRINITY BANK N.A.
(Unaudited)
(Dollars in thousands, except per share data)
|
|
Quarter Ended | Twelve Months Ending | ||||||||||||||||||||||
|
|
December 31 | December 31 | ||||||||||||||||||||||
|
EARNINGS SUMMARY
|
2019 | 2018 | Change | 2019 | 2018 | Change | ||||||||||||||||||
|
|
||||||||||||||||||||||||
|
Interest income
|
$ | 2,996 | $ | 2,785 | 7.6% | $ | 11,812 | $ | 10,520 | 12.3% | ||||||||||||||
|
Interest expense
|
490 | 358 | 36.9% | 1,852 | 1,118 | 65.7% | ||||||||||||||||||
|
Net Interest Income
|
2,506 | 2,427 | 3.3% | 9,960 | 9,402 | 5.9% | ||||||||||||||||||
|
|
||||||||||||||||||||||||
|
Service charges on deposits
|
48 | 31 | 54.8% | 175 | 148 | 18.2% | ||||||||||||||||||
|
Other income
|
79 | 101 | -21.8% | 338 | 399 | -15.3% | ||||||||||||||||||
|
Total Non Interest Income
|
127 | 132 | -3.8% | 513 | 547 | -6.2% | ||||||||||||||||||
|
|
||||||||||||||||||||||||
|
Salaries and benefits expense
|
740 | 757 | -2.2% | 3,104 | 2,823 | 10.0% | ||||||||||||||||||
|
Occupancy and equipment expense
|
93 | 120 | -22.5% | 436 | 466 | -6.4% | ||||||||||||||||||
|
Other expense
|
370 | 289 | 28.0% | 1,301 | 1,245 | 4.5% | ||||||||||||||||||
|
Total Non Interest Expense
|
1,203 | 1,166 | 3.2% | 4,841 | 4,534 | 6.8% | ||||||||||||||||||
|
|
||||||||||||||||||||||||
|
Pretax pre-provision income
|
1,430 | 1,393 | 2.7% | 5,632 | 5,415 | 4.0% | ||||||||||||||||||
|
|
||||||||||||||||||||||||
|
Gain on sale of securities
|
0 | 3 | N/M | 10 | 14 | N/M | ||||||||||||||||||
|
|
||||||||||||||||||||||||
|
Provision for Loan Losses
|
0 | 30 | N/M | 1,030 | 90 | N/M | ||||||||||||||||||
|
|
||||||||||||||||||||||||
|
Earnings before income taxes
|
1,430 | 1,366 | 4.7% | 4,612 | 5,339 | -13.6% | ||||||||||||||||||
|
Provision for income taxes
|
210 | 166 | 26.5% | 569 | 662 | -14.0% | ||||||||||||||||||
|
Net Earnings
|
$ | 1,220 | $ | 1,200 | 1.7% | $ | 4,043 | $ | 4,677 | -13.6% | ||||||||||||||
|
|
||||||||||||||||||||||||
|
Basic earnings per share
|
1.12 | 1.09 | 2.4% | 3.69 | 4.24 | -13.0% | ||||||||||||||||||
|
Basic weighted average shares outstanding
|
1,092 | 1,100 | 1,096 | 1,102 | ||||||||||||||||||||
|
|
||||||||||||||||||||||||
|
Diluted earnings per share - estimate
|
1.10 | 1.08 | 1.9% | 3.63 | 4.19 | -13.4% | ||||||||||||||||||
|
Diluted weighted average shares outstanding
|
1,111 | 1,115 | 1,115 | 1,117 | ||||||||||||||||||||
|
|
||||||||||||||||||||||||
|
|
||||||||||||||||||||||||
|
|
||||||||||||||||||||||||
| Average for Quarter | Average for Twelve Months | |||||||||||||||||||||||
| December 31 | December 31 | |||||||||||||||||||||||
|
BALANCE SHEET SUMMARY
|
2019 | 2018 | Change | 2019 | 2018 | Change | ||||||||||||||||||
|
|
||||||||||||||||||||||||
|
Total loans
|
$ | 154,764 | $ | 144,801 | 6.9% | $ | 154,842 | $ | 143,869 | 7.6% | ||||||||||||||
|
Total short term investments
|
69,110 | 23,175 | 198.2% | 36,120 | 18,854 | 91.6% | ||||||||||||||||||
|
Total investment securities
|
70,508 | 79,700 | -11.5% | 74,127 | 84,427 | -12.2% | ||||||||||||||||||
|
|
||||||||||||||||||||||||
|
Earning assets
|
294,382 | 247,676 | 18.9% | 265,089 | 247,150 | 7.3% | ||||||||||||||||||
|
|
||||||||||||||||||||||||
|
Total assets
|
301,596 | 255,113 | 18.2% | 272,704 | 254,343 | 7.2% | ||||||||||||||||||
|
|
||||||||||||||||||||||||
|
Noninterest bearing deposits
|
101,932 | 81,187 | 25.6% | 81,381 | 81,783 | -0.5% | ||||||||||||||||||
|
Interest bearing deposits
|
168,784 | 141,081 | 19.6% | 154,650 | 139,807 | 10.6% | ||||||||||||||||||
|
|
||||||||||||||||||||||||
|
Total deposits
|
270,716 | 222,268 | 21.8% | 236,031 | 221,590 | 6.5% | ||||||||||||||||||
|
|
||||||||||||||||||||||||
|
Fed Funds Purchased and Repurchase Agreements
|
0 | 0 | N/M | 292 | 390 | N/M | ||||||||||||||||||
|
|
||||||||||||||||||||||||
|
Shareholders' equity
|
$ | 35,382 | $ | 31,948 | 10.7% | $ | 35,009 | $ | 31,664 | 10.6% | ||||||||||||||
|
|
||||||||||||||||||||||||
TRINITY BANK N.A.
(Unaudited)
(Dollars in thousands, except per share data)
|
|
Average for Quarter Ending | |||||||||||||||||||
|
|
Dec 31, | Sept. 30, | June 30, | March 31, | Dec 31, | |||||||||||||||
|
BALANCE SHEET SUMMARY
|
2019 | 2019 | 2019 | 2019 | 2018 | |||||||||||||||
|
|
||||||||||||||||||||
|
Total loans
|
$ | 154,764 | $ | 156,304 | $ | 156,571 | $ | 152,227 | $ | 144,801 | ||||||||||
|
Total short term investments
|
69,110 | 35,991 | 26,034 | 12,728 | 23,175 | |||||||||||||||
|
Total investment securities
|
70,508 | 72,212 | 74,627 | 79,278 | 79,700 | |||||||||||||||
|
|
||||||||||||||||||||
|
Earning assets
|
294,382 | 264,507 | 257,232 | 244,233 | 247,676 | |||||||||||||||
|
|
||||||||||||||||||||
|
Total assets
|
301,596 | 272,245 | 264,826 | 251,901 | 255,113 | |||||||||||||||
|
|
||||||||||||||||||||
|
Noninterest bearing deposits
|
101,932 | 82,822 | 73,665 | 73,881 | 81,187 | |||||||||||||||
|
Interest bearing deposits
|
168,784 | 152,296 | 154,918 | 142,339 | 141,081 | |||||||||||||||
|
|
||||||||||||||||||||
|
Total deposits
|
270,716 | 235,118 | 228,583 | 216,220 | 222,268 | |||||||||||||||
|
|
||||||||||||||||||||
|
Fed Funds Purchased and Repurchase Agreements
|
0 | 0 | 0 | 1,187 | 0 | |||||||||||||||
|
|
||||||||||||||||||||
|
Shareholders' equity
|
$ | 35,382 | $ | 36,081 | $ | 35,301 | $ | 33,940 | $ | 31,948 | ||||||||||
|
|
||||||||||||||||||||
|
|
||||||||||||||||||||
| Quarter Ended | ||||||||||||||||||||
| Dec 31, | Sept. 30, | June 30, | March 31, | Dec 31, | ||||||||||||||||
|
HISTORICAL EARNINGS SUMMARY
|
2019 | 2019 | 2019 | 2019 | 2018 | |||||||||||||||
|
|
||||||||||||||||||||
|
|
||||||||||||||||||||
|
Interest income
|
$ | 2,996 | $ | 3,025 | $ | 2,977 | $ | 2,814 | $ | 2,785 | ||||||||||
|
Interest expense
|
490 | 493 | 475 | 394 | 358 | |||||||||||||||
|
Net Interest Income
|
2,506 | 2,532 | 2,502 | 2,420 | 2,427 | |||||||||||||||
|
|
||||||||||||||||||||
|
Service charges on deposits
|
48 | 36 | 42 | 40 | 31 | |||||||||||||||
|
Other income
|
79 | 104 | 80 | 83 | 101 | |||||||||||||||
|
Total Non Interest Income
|
127 | 140 | 122 | 123 | 132 | |||||||||||||||
|
|
||||||||||||||||||||
|
Salaries and benefits expense
|
740 | 813 | 788 | 763 | 757 | |||||||||||||||
|
Occupancy and equipment expense
|
93 | 120 | 116 | 107 | 120 | |||||||||||||||
|
Other expense
|
370 | 299 | 375 | 259 | 289 | |||||||||||||||
|
Total Non Interest Expense
|
1,203 | 1,232 | 1,279 | 1,129 | 1,166 | |||||||||||||||
|
|
||||||||||||||||||||
|
Pretax pre-provision income
|
1,430 | 1,440 | 1,345 | 1,414 | 1,393 | |||||||||||||||
|
|
||||||||||||||||||||
|
Gain on sale of securities
|
0 | 12 | 1 | (2 | ) | 3 | ||||||||||||||
|
Gain on sale of foreclosed assets
|
0 | 0 | 0 | 0 | 0 | |||||||||||||||
|
Gain on sale of other assets
|
0 | 0 | 0 | 0 | 0 | |||||||||||||||
|
|
||||||||||||||||||||
|
Provision for Loan Losses
|
0 | 0 | 1,000 | 30 | 30 | |||||||||||||||
|
|
||||||||||||||||||||
|
Earnings before income taxes
|
1,430 | 1,452 | 346 | 1,382 | 1,366 | |||||||||||||||
|
Provision for income taxes
|
210 | 206 | (28 | ) | 180 | 166 | ||||||||||||||
|
|
||||||||||||||||||||
|
Net Earnings
|
$ | 1,220 | $ | 1,246 | $ | 374 | $ | 1,202 | $ | 1,200 | ||||||||||
|
|
||||||||||||||||||||
|
Diluted earnings per share
|
$ | 1.12 | $ | 1.08 | $ | 0.33 | $ | 1.08 | $ | 1.08 | ||||||||||
TRINITY BANK N.A.
(Unaudited)
(Dollars in thousands, except per share data)
|
|
Ending Balance | |||||||||||||||||||
|
|
Dec 31, | Sept. 30, | June 30, | March 31, | Dec 31, | |||||||||||||||
|
HISTORICAL BALANCE SHEET
|
2019 | 2019 | 2019 | 2019 | 2018 | |||||||||||||||
|
|
||||||||||||||||||||
|
Total loans
|
$ | 167,587 | $ | 157,475 | $ | 156,014 | $ | 160,028 | $ | 154,184 | ||||||||||
|
Total short term investments
|
60,603 | 56,328 | 19,321 | 14,160 | 13,127 | |||||||||||||||
|
Total investment securities
|
70,804 | 71,394 | 72,014 | 75,906 | 81,896 | |||||||||||||||
|
|
||||||||||||||||||||
|
Total earning assets
|
298,994 | 285,197 | 247,349 | 250,094 | 249,207 | |||||||||||||||
|
|
||||||||||||||||||||
|
Allowance for loan losses
|
(2,262 | ) | (2,259 | ) | (2,224 | ) | (1,703 | ) | (1,671 | ) | ||||||||||
|
Premises and equipment
|
2,560 | 2,544 | 2,580 | 2,613 | 2,627 | |||||||||||||||
|
Other Assets
|
9,770 | 9,513 | 8,040 | 5,506 | 7,018 | |||||||||||||||
|
|
||||||||||||||||||||
|
Total assets
|
309,062 | 294,995 | 255,745 | 256,510 | 257,181 | |||||||||||||||
|
|
||||||||||||||||||||
|
Noninterest bearing deposits
|
100,527 | 97,519 | 76,168 | 69,934 | 85,668 | |||||||||||||||
|
Interest bearing deposits
|
170,191 | 159,712 | 143,710 | 150,895 | 137,979 | |||||||||||||||
|
|
||||||||||||||||||||
|
Total deposits
|
270,718 | 257,231 | 219,878 | 220,829 | 223,647 | |||||||||||||||
|
|
||||||||||||||||||||
|
Fed Funds Purchased and Repurchase Agreements
|
0 | 0 | 0 | 0 | 0 | |||||||||||||||
|
Other Liabilities
|
1,047 | 1,830 | 614 | 1,158 | 701 | |||||||||||||||
|
|
||||||||||||||||||||
|
Total liabilities
|
271,765 | 259,061 | 220,492 | 221,987 | 224,348 | |||||||||||||||
|
|
||||||||||||||||||||
|
Shareholders' Equity Actual
|
35,858 | 34,920 | 34,572 | 34,522 | 34,051 | |||||||||||||||
|
Unrealized Gain - AFS
|
1,439 | 1,014 | 681 | 1 | (1,218) | |||||||||||||||
|
Total Equity
|
$ | 37,297 | $ | 35,934 | $ | 35,253 | $ | 34,523 | $ | 32,833 | ||||||||||
|
|
||||||||||||||||||||
|
|
||||||||||||||||||||
| Quarter Ending | ||||||||||||||||||||
| Dec 31, | Sept. 30, | June 30, | March 31, | Dec 31, | ||||||||||||||||
|
NONPERFORMING ASSETS
|
2019 | 2019 | 2019 | 2019 | 2018 | |||||||||||||||
|
|
||||||||||||||||||||
|
Nonaccrual loans
|
$ | 419 | $ | 432 | $ | 446 | $ | 952 | $ | 60 | ||||||||||
|
Restructured loans
|
$ | 0 | $ | 0 | $ | 0 | $ | 0 | $ | 0 | ||||||||||
|
Other real estate & foreclosed assets
|
$ | 320 | $ | 320 | $ | 320 | $ | 0 | $ | 0 | ||||||||||
|
Accruing loans past due 90 days or more
|
$ | 0 | $ | 0 | $ | 0 | $ | 0 | $ | 0 | ||||||||||
|
Total nonperforming assets
|
$ | 739 | $ | 752 | $ | 766 | $ | 952 | $ | 60 | ||||||||||
|
|
||||||||||||||||||||
|
Accruing loans past due 30-89 days
|
$ | 0 | $ | 0 | $ | 0 | $ | 477 | $ | 0 | ||||||||||
|
|
||||||||||||||||||||
|
Total nonperforming assets as a percentage
|
||||||||||||||||||||
|
of loans and foreclosed assets
|
0.44 | % | 0.45 | % | 0.49 | % | 0.59 | % | 0.04 | % | ||||||||||
|
|
||||||||||||||||||||
TRINITY BANK N.A.
(Unaudited)
(Dollars in thousands, except per share data)
|
|
Quarter Ending | |||||||||||||||||||||
|
ALLOWANCE FOR
|
Dec 31, | Sept. 30, | June 30, | March 31, | Dec 31, | |||||||||||||||||
|
LOAN LOSSES
|
2019 | 2019 | 2019 | 2019 | 2018 | |||||||||||||||||
|
|
||||||||||||||||||||||
|
Balance at beginning of period
|
$ | 2,259 | $ | 2,224 | $ | 1,703 | $ | 1,671 | $ | 1,664 | ||||||||||||
|
Loans charged off
|
0 | 0 | 498 | 0 | 23 | |||||||||||||||||
|
Loan recoveries
|
3 | 35 | 19 | 2 | 0 | |||||||||||||||||
|
Net (charge-offs) recoveries
|
3 | 35 | (479 | ) | 2 | (23 | ) | |||||||||||||||
|
Provision for loan losses
|
0 | 0 | 1,000 | 30 | 30 | |||||||||||||||||
|
Balance at end of period
|
$ | 2,262 | $ | 2,259 | $ | 2,224 | $ | 1,703 | $ | 1,671 | ||||||||||||
|
|
||||||||||||||||||||||
|
Allowance for loan losses
|
||||||||||||||||||||||
|
as a percentage of total loans
|
1.35 | % | 1.43 | % | 1.43 | % | 1.06 | % | 1.08 | % | ||||||||||||
|
Allowance for loan losses
|
||||||||||||||||||||||
|
as a percentage of nonperforming assets
|
306 | % | 300 | % | 290 | % | 179 | % | 2785 | % | ||||||||||||
|
Net charge-offs (recoveries) as a
|
||||||||||||||||||||||
|
percentage of average loans
|
0.00 | % | -0.02 | % | 0.31 | % | -0.01 | % | 0.02 | % | ||||||||||||
|
Provision for loan losses
|
||||||||||||||||||||||
|
as a percentage of average loans
|
0.00 | % | 0.00 | % | 0.64 | % | 0.02 | % | 0.02 | % | ||||||||||||
|
|
||||||||||||||||||||||
|
|
||||||||||||||||||||||
|
|
||||||||||||||||||||||
| Quarter Ending | ||||||||||||||||||||||
| Dec 31, |
|
June 30, | March 31, | Dec 31, | ||||||||||||||||||
|
SELECTED RATIOS
|
2019 | 2019 | 2019 | 2019 | 2018 | |||||||||||||||||
|
|
||||||||||||||||||||||
|
Return on average assets (annualized)
|
1.62 | % | 1.83 | % | 0.56 | % | 1.91 | % | 1.88 | % | ||||||||||||
|
|
||||||||||||||||||||||
|
Return on average equity (annualized)
|
13.34 | % | 13.81 | % | 4.24 | % | 14.17 | % | 15.02 | % | ||||||||||||
|
|
||||||||||||||||||||||
|
Return on average equity (excluding unrealized gain on investments)
|
13.79 | % | 14.21 | % | 4.27 | % | 13.90 | % | 14.39 | % | ||||||||||||
|
|
||||||||||||||||||||||
|
Average shareholders' equity to average assets
|
11.73 | % | 13.25 | % | 13.33 | % | 13.47 | % | 12.52 | % | ||||||||||||
|
|
||||||||||||||||||||||
|
Yield on earning assets (tax equivalent)
|
4.67 | % | 4.79 | % | 4.85 | % | 4.86 | % | 4.75 | % | ||||||||||||
|
|
||||||||||||||||||||||
|
Effective Cost of Funds
|
0.70 | % | 0.75 | % | 0.74 | % | 0.64 | % | 0.58 | % | ||||||||||||
|
|
||||||||||||||||||||||
|
Net interest margin (tax equivalent)
|
3.97 | % | 4.04 | % | 4.11 | % | 4.22 | % | 4.17 | % | ||||||||||||
|
|
||||||||||||||||||||||
|
Efficiency ratio (tax equivalent)
|
43.4 | % | 43.8 | % | 46.2 | % | 41.9 | % | 37.9 | % | ||||||||||||
|
|
||||||||||||||||||||||
|
End of period book value per common share
|
$ | 34.22 | $ | 32.85 | $ | 32.14 | $ | 31.44 | $ | 29.85 | ||||||||||||
|
|
||||||||||||||||||||||
|
End of period book value (excluding unrealized gain on investments)
|
$ | 32.90 | $ | 31.92 | $ | 31.52 | $ | 31.44 | $ | 30.96 | ||||||||||||
|
|
||||||||||||||||||||||
|
End of period common shares outstanding (in 000's)
|
1,090 | 1,094 | 1,097 | 1,098 | 1,100 | |||||||||||||||||
|
|
||||||||||||||||||||||
TRINITY BANK N.A.
(Unaudited)
(Dollars in thousands, except per share data)
|
|
Twelve Months Ending | |||||||||||||||||||||||||||||||
|
|
December 31,2019 | December 31,2018 | ||||||||||||||||||||||||||||||
|
|
||||||||||||||||||||||||||||||||
|
|
Tax | Tax | ||||||||||||||||||||||||||||||
|
|
Average | Equivalent | Average | Equivalent | ||||||||||||||||||||||||||||
|
YIELD ANALYSIS
|
Balance | Interest | Yield | Yield | Balance | Interest | Yield | Yield | ||||||||||||||||||||||||
|
|
||||||||||||||||||||||||||||||||
|
Interest Earning Assets:
|
||||||||||||||||||||||||||||||||
|
Short term investment
|
$ | 35,738 | 708 | 1.98% | 1.98 | $ | 18,478 | 378 | 2.05 | 2.05% | ||||||||||||||||||||||
|
FRB Stock
|
382 | 23 | 6.00% | 6.00 | 367 | 23 | 6.00 | 6.00% | ||||||||||||||||||||||||
|
Taxable securities
|
622 | 13 | 2.09% | 2.09 | 0 | 0 | 0.00 | 0.00% | ||||||||||||||||||||||||
|
Tax Free securities
|
73,505 | 2,160 | 2.94% | 3.72 | 84,427 | 2,387 | 2.83 | 3.58% | ||||||||||||||||||||||||
|
Loans
|
154,938 | 8,908 | 5.75% | 5.75 | 143,869 | 7,732 | 5.37 | 5.37% | ||||||||||||||||||||||||
|
|
||||||||||||||||||||||||||||||||
|
Total Interest Earning Assets
|
265,185 | 11,812 | 4.45% | 4.67 | 247,141 | 10,520 | 4.26 | 4.51% | ||||||||||||||||||||||||
|
|
||||||||||||||||||||||||||||||||
|
Noninterest Earning Assets:
|
||||||||||||||||||||||||||||||||
|
Cash and due from banks
|
5,100 | 4,411 | ||||||||||||||||||||||||||||||
|
Other assets
|
4,406 | 4,427 | ||||||||||||||||||||||||||||||
|
Allowance for loan losses
|
(1,987 | ) | (1,636 | ) | ||||||||||||||||||||||||||||
|
|
||||||||||||||||||||||||||||||||
|
Total Noninterest Earning Assets
|
7,519 | 7,202 | ||||||||||||||||||||||||||||||
|
|
||||||||||||||||||||||||||||||||
|
Total Assets
|
$ | 272,704 | $ | 254,343 | ||||||||||||||||||||||||||||
|
|
||||||||||||||||||||||||||||||||
|
Interest Bearing Liabilities:
|
||||||||||||||||||||||||||||||||
|
Transaction and Money Market accounts
|
121,613 | 1,217 | 1.00 | 1.00 | 115,271 | 797 | 0.69 | 0.69 | ||||||||||||||||||||||||
|
Certificates and other time deposits
|
33,037 | 626 | 1.89 | 1.89 | 24,536 | 311 | 1.27 | 1.27 | ||||||||||||||||||||||||
|
Other borrowings
|
293 | 9 | 3.07 | 3.07 | 390 | 10 | 2.56 | 2.56 | ||||||||||||||||||||||||
|
|
||||||||||||||||||||||||||||||||
|
Total Interest Bearing Liabilities
|
154,943 | 1,852 | 1.20 | 1.20 | 140,197 | 1,118 | 0.80 | 0.80 | ||||||||||||||||||||||||
|
|
||||||||||||||||||||||||||||||||
|
Noninterest Bearing Liabilities:
|
||||||||||||||||||||||||||||||||
|
Demand deposits
|
81,381 | 81,783 | ||||||||||||||||||||||||||||||
|
Other liabilities
|
1,371 | 699 | ||||||||||||||||||||||||||||||
|
Shareholders' Equity
|
35,009 | 31,664 | ||||||||||||||||||||||||||||||
|
|
||||||||||||||||||||||||||||||||
|
Total Liabilities and Shareholders Equity
|
$ | 272,704 | $ | 254,343 | ||||||||||||||||||||||||||||
|
|
||||||||||||||||||||||||||||||||
|
Net Interest Income and Spread
|
9,960 | 3.26% | 3.47% | 9,402 | 3.46% | 3.71% | ||||||||||||||||||||||||||
|
|
||||||||||||||||||||||||||||||||
|
Net Interest Margin
|
3.76% | 3.97% | 3.50% | 4.06% | ||||||||||||||||||||||||||||
|
|
||||||||||||||||||||||||||||||||
TRINITY BANK N.A.
(Unaudited)
(Dollars in thousands, except per share data)
|
|
Quarter Ending | Quarter Ending | ||||||||||||||
|
|
December 31 | December 31 | ||||||||||||||
|
|
2019 | 2018 | ||||||||||||||
|
LOAN PORTFOLIO
|
||||||||||||||||
|
|
||||||||||||||||
|
Commercial and industrial
|
$ | 98,099 | 58.54 | $ | 80,226 | 57.38 | ||||||||||
|
Real estate:
|
||||||||||||||||
|
Commercial
|
24,133 | 14.40% | 18,672 | 13.35% | ||||||||||||
|
Residential
|
23,115 | 13.79% | 24,335 | 17.40% | ||||||||||||
|
Construction and development
|
21,692 | 12.94% | 15,885 | 11.36% | ||||||||||||
|
Consumer
|
548 | 0.33% | 700 | 0.50% | ||||||||||||
|
|
||||||||||||||||
|
Total loans (gross)
|
167,587 | 100.00% | 139,818 | 100.00% | ||||||||||||
|
|
||||||||||||||||
|
Unearned discounts
|
0 | 0.00% | 0 | 0.00% | ||||||||||||
|
|
||||||||||||||||
|
Total loans (net)
|
$ | 167,587 | 100.00% | $ | 139,818 | 100.00% | ||||||||||
|
|
||||||||||||||||
|
|
||||||||||||||||
| December 31 | December 31 | |||||||||||||||
|
|
2019 | 2018 | ||||||||||||||
|
REGULATORY CAPITAL DATA
|
||||||||||||||||
|
Tier 1 Capital
|
$ | 35,859 | $ | 34,051 | ||||||||||||
|
Total Capital (Tier 1 + Tier 2)
|
$ | 38,121 | $ | 35,722 | ||||||||||||
|
Total Risk-Adjusted Assets
|
$ | 181,050 | $ | 171,326 | ||||||||||||
|
Tier 1 Risk-Based Capital Ratio
|
19.81 | 19.88 | ||||||||||||||
|
Total Risk-Based Capital Ratio
|
21.06 | 20.85 | ||||||||||||||
|
Tier 1 Leverage Ratio
|
11.89 | 13.35 | ||||||||||||||
|
|
||||||||||||||||
|
OTHER DATA
|
||||||||||||||||
|
Full Time Equivalent
|
||||||||||||||||
|
Employees (FTE's)
|
22 | 20 | ||||||||||||||
|
|
||||||||||||||||
|
Stock Price Range
|
||||||||||||||||
|
(For the Three Months Ended):
|
||||||||||||||||
|
High
|
$ | 65.50 | $ | 67.00 | ||||||||||||
|
Low
|
$ | 62.00 | $ | 59.05 | ||||||||||||
|
Close
|
$ | 64.98 | $ | 65.50 | ||||||||||||
|
|
||||||||||||||||
SOURCE: Trinity Bank N.A.